Beszel has rapidly emerged as the perfect middle ground between basic uptime monitoring and enterprise-scale complexity, gaining over 16,500 GitHub stars since its 2024 launch. This comprehensive Beszel installation guide explores what makes this self-hosted monitoring platform a game-changer for developers, sysadmins, and homelab enthusiasts.
What is Beszel and why it stands out
Beszel is a lightweight server monitoring hub built on PocketBase that provides historical data, Docker statistics, and intelligent alerts through a clean web interface. Unlike heavyweight solutions like Prometheus and Grafana that demand hours of configuration, Beszel gets you monitoring multiple servers in minutes. The platform uses only 6MB of RAM for agents and 23MB for the hub—drastically lighter than Netdata’s 2-4% CPU overhead or the resource-hungry Prometheus stack.
The architecture follows a hub-agent model where a central web application (hub) aggregates metrics from lightweight daemons (agents) deployed on monitored systems. What sets Beszel apart is its dual-protocol flexibility: agents can connect via SSH (hub-initiated on port 45876) or WebSocket (agent-initiated), enabling deployment in restrictive network environments without exposing services to the public internet. The system tracks comprehensive metrics including CPU usage, memory (with swap and ZFS ARC), disk I/O, network statistics, Docker container performance, GPU monitoring (Nvidia, AMD, Intel), temperature sensors, battery levels, and S.M.A.R.T. disk health data.
Built entirely in Go with a modern web UI, Beszel compiles to single static binaries requiring no complex dependencies. The PocketBase backend provides built-in user authentication with OAuth2/OIDC support, automatic S3-compatible backups, RESTful APIs, and multi-user access control where admins can share systems across teams. This all-in-one approach eliminates the typical monitoring stack complexity of managing separate databases, visualization tools, and authentication layers.
System requirements for running Beszel
Beszel’s minimal footprint makes it deployable on virtually any modern system. For Docker deployments, you need Docker 20.10+ or Podman with host network mode recommended for accurate network statistics. The hub requires approximately 50-100MB RAM under normal operation with disk space for the SQLite database (typically 100MB-1GB depending on retention and monitored systems). Agents consume just 6-15MB RAM with negligible CPU impact.
Binary installations support Linux (Ubuntu, Debian, Fedora, Arch, Alpine), macOS (Intel and Apple Silicon via Homebrew), Windows (via WinGet, Scoop, or binary), and FreeBSD. For GPU monitoring, you’ll need nvidia-smi (Nvidia), rocm-smi (AMD), or intel_gpu_top (Intel) installed and accessible. Windows systems require .NET Framework for hardware monitoring capabilities. The hub should be deployed on a system with consistent uptime and reliable storage, while agents can run on any server, VM, LXC container, or even Raspberry Pi devices.
Network requirements include port 8090 for the hub web interface (customizable) and port 45876 for agent SSH connections (or WebSocket on 8090). Agents behind firewalls or NAT can use WebSocket connections to phone home, making Beszel exceptionally flexible for monitoring VPS fleets, Tailscale networks, or cloud infrastructure without opening inbound firewall rules.
Beszel installation guide: Three methods compared
Docker Compose installation (recommended)
Docker provides the fastest path to production with automatic updates and easy rollbacks. Create a docker-compose.yml for the hub:
services:
  beszel:
    image: henrygd/beszel
    container_name: beszel
    restart: unless-stopped
    ports:
      - 8090:8090
    volumes:
      - ./beszel_data:/beszel_data
Deploy with docker compose up -d, then access the web interface at http://your-server:8090 to create your admin account. The initial setup generates ED25519 SSH keys automatically.
For agents, use the command generated in the Beszel web UI after clicking “Add System”:
services:
  beszel-agent:
    image: henrygd/beszel-agent
    container_name: beszel-agent
    restart: unless-stopped
    network_mode: host
    volumes:
      - /var/run/docker.sock:/var/run/docker.sock:ro
    environment:
      PORT: 45876
      KEY: "your-hub-public-key"
      FILESYSTEM: /dev/sda1
The network_mode: host setting ensures accurate network interface statistics. For GPU monitoring, use henrygd/beszel-agent:nvidia with NVIDIA Container Toolkit installed. Alpine users should deploy henrygd/beszel-agent:alpine for systems where the standard Debian-based image has compatibility issues.
Binary installation for maximum control
Binary installation offers GPU monitoring support unavailable in Docker agents and lower overhead for resource-constrained systems. On Linux, use the one-line installer:
curl -sL https://get.beszel.dev | bashThis script downloads the appropriate binary, creates a systemd service, and configures firewall rules. For manual installation, download from GitHub releases and create a service unit:
# Download and extract
wget https://github.com/henrygd/beszel/releases/latest/download/beszel-agent_linux_amd64.tar.gz
tar -xzf beszel-agent_linux_amd64.tar.gz
sudo mv beszel-agent /usr/local/bin/

# Create systemd service
sudo nano /etc/systemd/system/beszel-agent.service
The service file should specify environment variables for PORT, KEY (hub’s public key), and FILESYSTEM. Enable and start with sudo systemctl enable --now beszel-agent.
Windows users can install via WinGet (winget install henrygd.beszel-agent), Scoop, or manually download the binary and register as a service using NSSM or Shawl. The Windows agent includes LibreHardwareMonitorLib for comprehensive hardware sensor access.
macOS installation via Homebrew: brew tap henrygd/beszel && brew install beszel-agent. Launch with brew services start beszel-agent after configuring environment variables in the plist file.
Building from source for custom deployments
Advanced users requiring modifications can compile from source. Clone the repository with git clone --branch v0.15.4 https://github.com/henrygd/beszel.git and navigate to the directory. Install Go 1.21+ and run make to build both hub and agent, or make build-agent for agents only.
For hub compilation, first build the web UI: cd src/site && bun install && bun run build (or use npm/yarn). Windows builds require an additional step: dotnet build -c Release ./agent/lhm/beszel_lhm.csproj to embed the .NET hardware monitoring wrapper.
Cross-compile for different platforms with: GOOS=freebsd GOARCH=arm64 go build -ldflags "-w -s" . in src/cmd/agent or src/cmd/hub. This creates optimized binaries with stripped symbols for minimal size.
Configuration essentials: Getting metrics flowing
After installation, add your first system through the Beszel web dashboard at Settings → Systems → Add System. The interface generates a configuration including the hub’s public SSH key and an optional universal token for automatic registration. Copy the provided Docker command or environment variables to your agent installation.
Critical environment variables for agents include:
KEY: Hub’s public SSH key (required for SSH connections)TOKEN: Universal token for WebSocket self-registrationHUB_URL: WebSocket endpoint likewss://beszel.yourdomain.comFILESYSTEM: Explicit filesystem path (/dev/sda1,C:, etc.) when auto-detection failsEXTRA_FILESYSTEMS: Additional disks to monitor (D:,E:,F:or/dev/sdb1,/dev/sdc1)DOCKER_HOST: Custom Docker socket path (default:/var/run/docker.sock)GPU: Enable GPU monitoring for binary agentsCONTAINER_DETAILS: Control access to Docker logs and container information
For the hub, key settings include:
BESZEL_HUB_DISABLE_PASSWORD_AUTH: Force OAuth-only authenticationSHARE_ALL_SYSTEMS: Allow all users to view all monitored systemsMFA_OTP: Enable email-based two-factor authenticationAPP_URL: Set the canonical URL for notification links and agent configs
Filesystem detection gotchas: Docker agents often misidentify the root filesystem. Find the correct path with lsblk, df -h, or sudo fdisk -l and explicitly set the FILESYSTEM variable. For monitoring multiple drives, mount additional partitions as read-only volumes and specify in EXTRA_FILESYSTEMS.
OAuth and OIDC setup requires configuring a provider (Authentik, Keycloak, Authelia, etc.) with redirect URI https://your-beszel-url/api/oauth2-redirect. Enable user creation with USER_CREATION=true, otherwise the admin must manually create accounts in Settings → Collections → users before OAuth users can log in.
Using Beszel: From dashboard to alerts
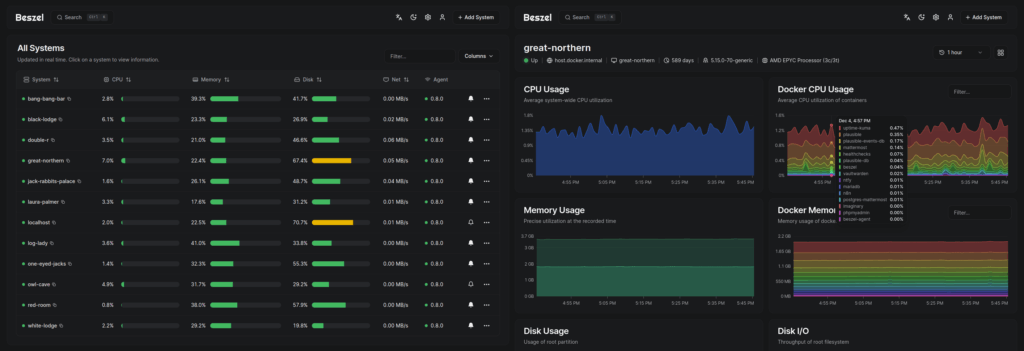
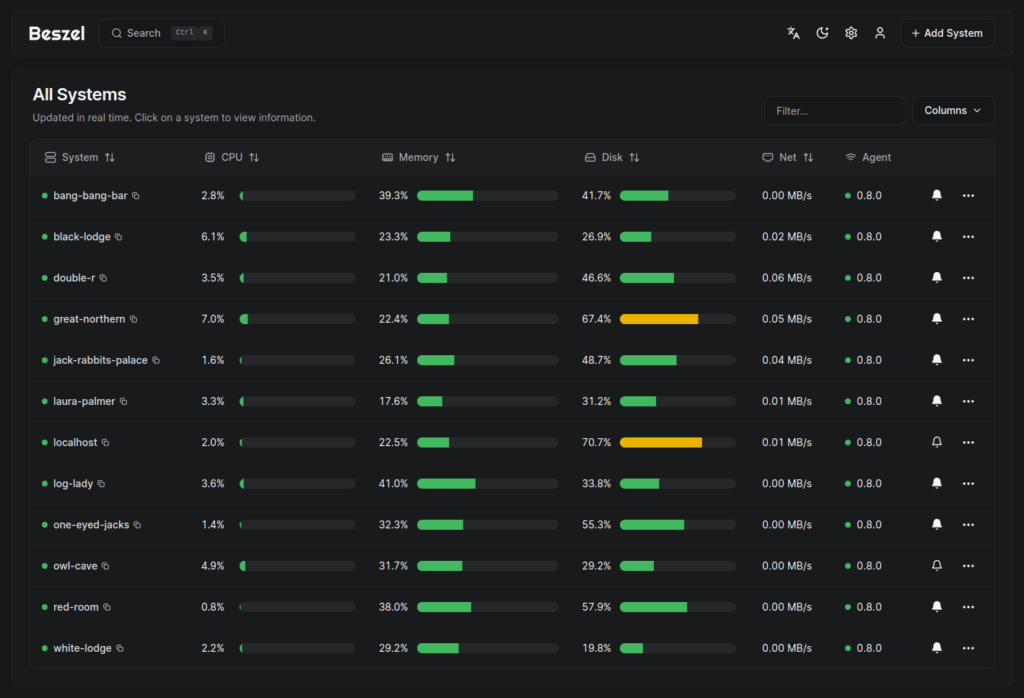
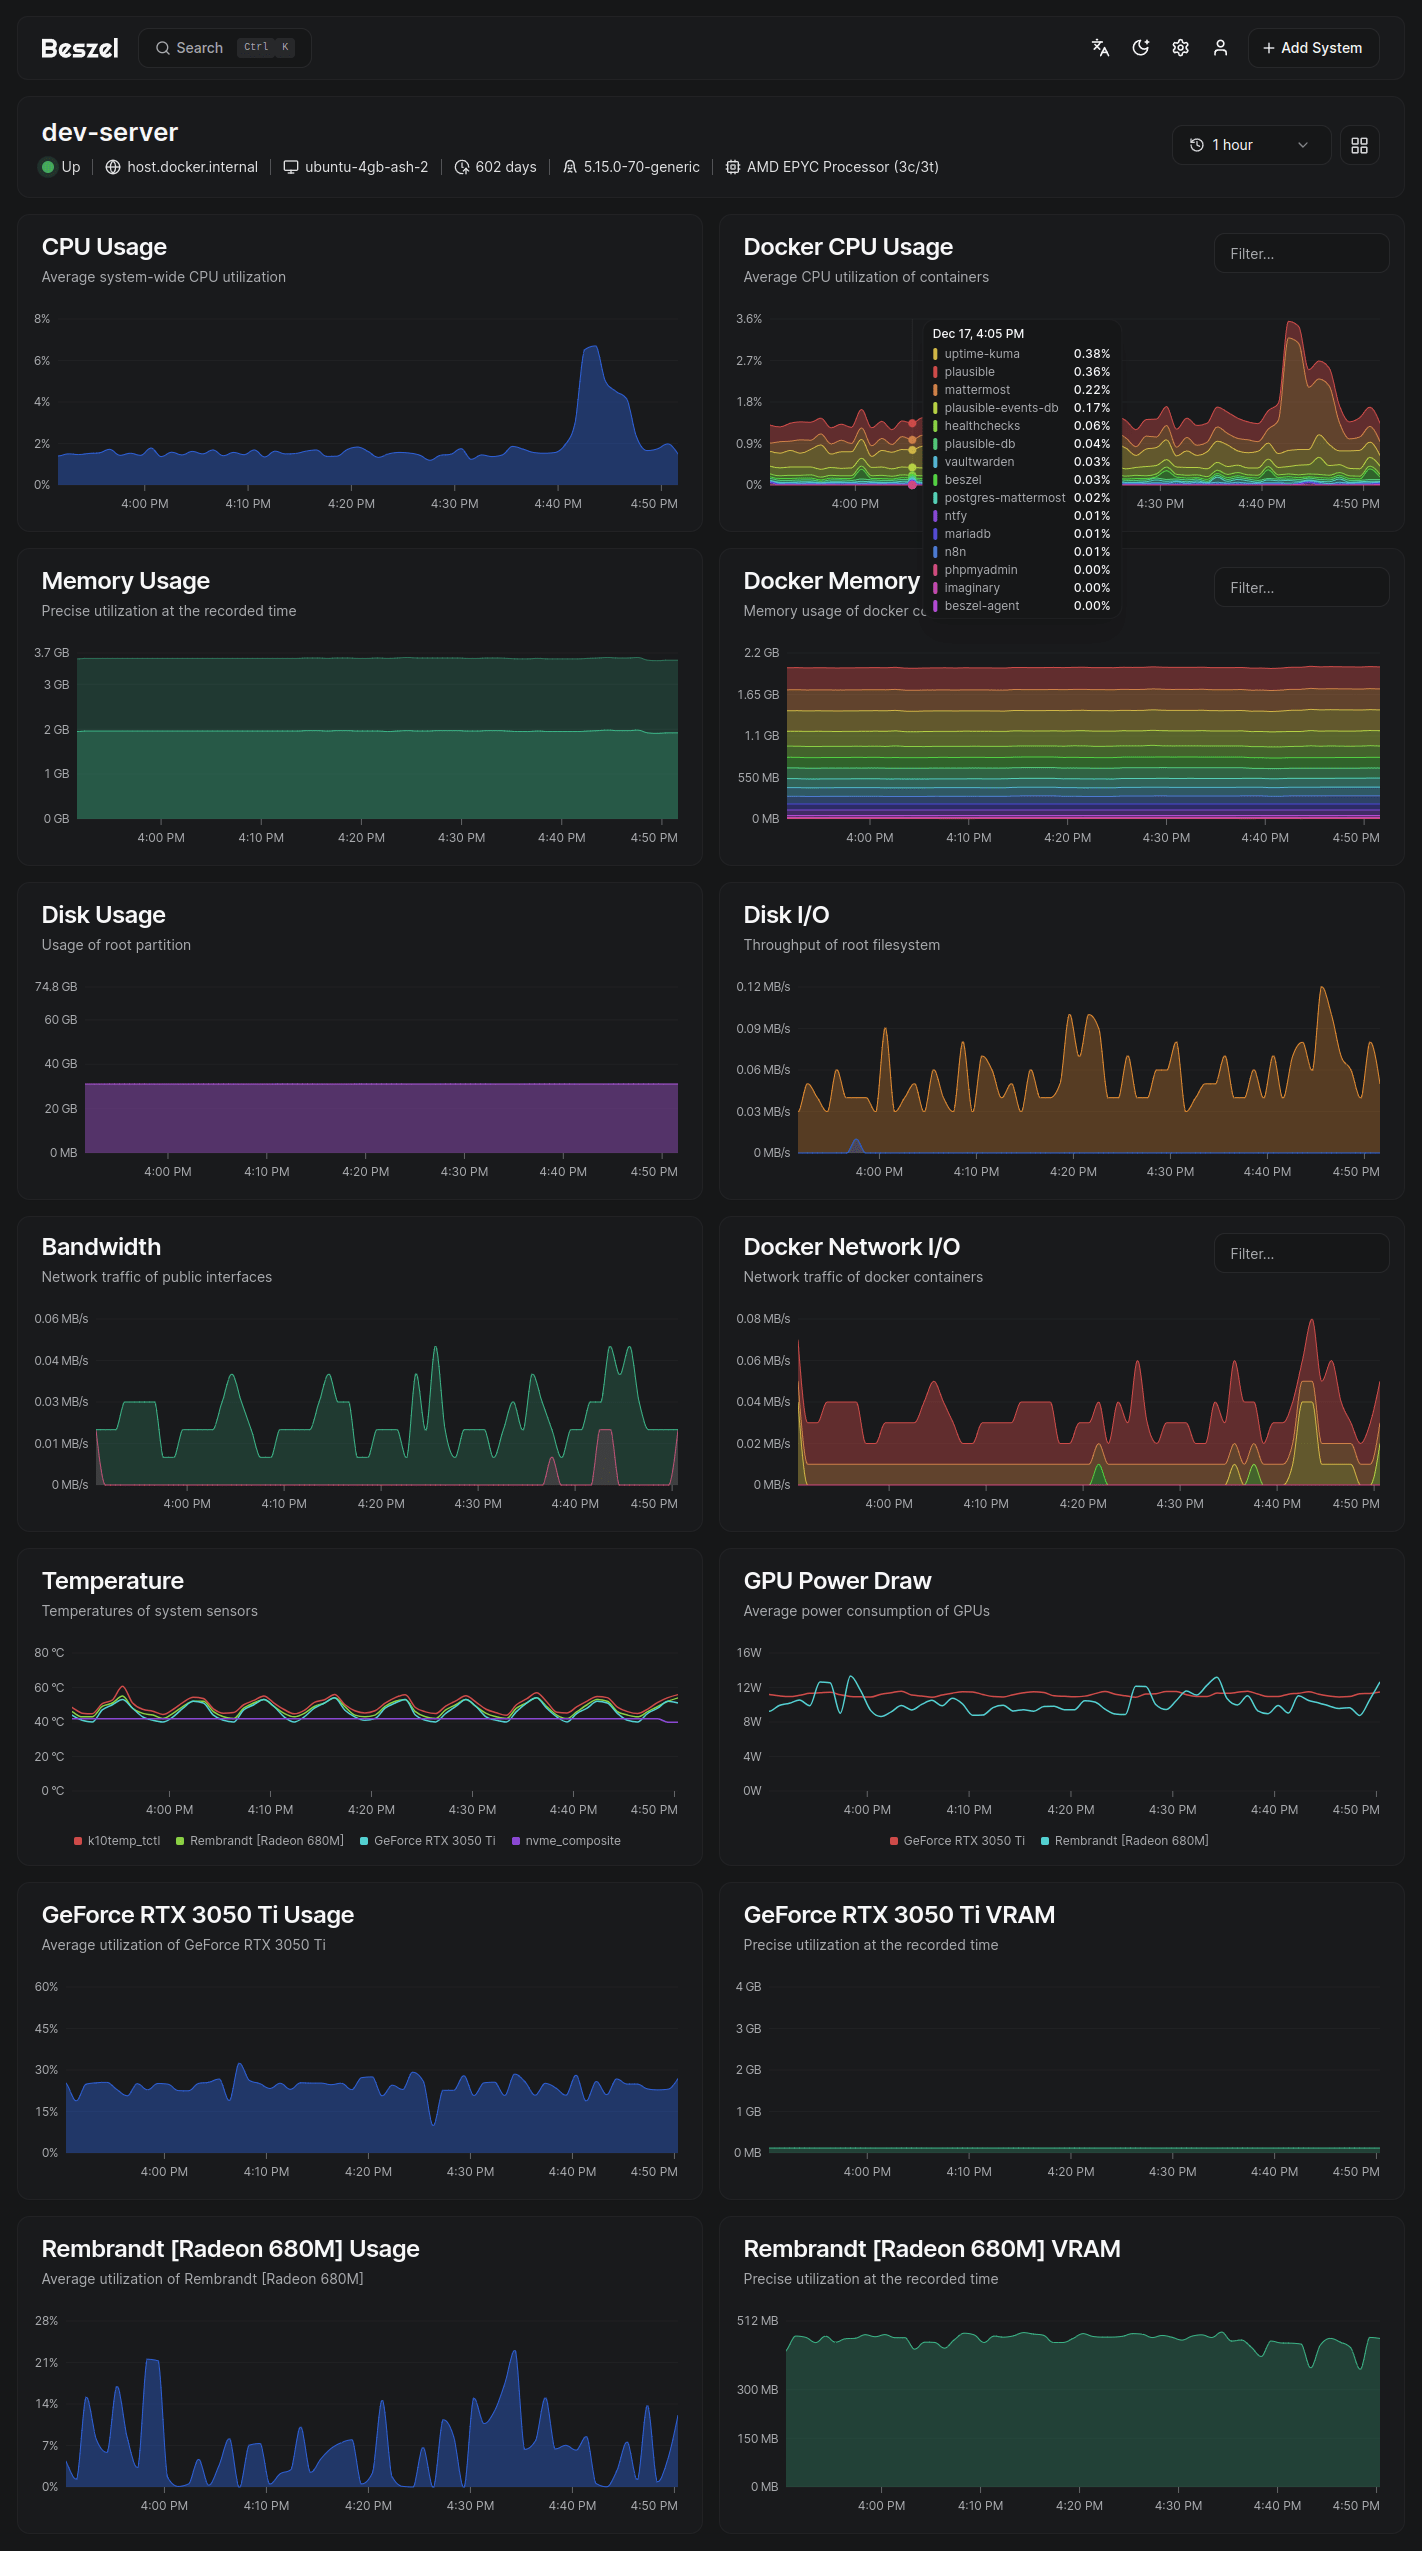
The main dashboard presents a unified view of all monitored systems with real-time status indicators, current resource utilization, and quick-access charts. Green indicators show healthy systems, yellow warns of threshold breaches, and red signals offline agents or critical alerts. Click any system to drill into detailed metrics with 1-second, 1-minute, 1-hour, 12-hour, 24-hour, week, and month views.
Docker container monitoring appears automatically when agents detect a Docker socket. The Containers tab lists all running containers with individual CPU, memory, and network statistics. Per-container history charts reveal resource trends and help identify misbehaving services. The CONTAINER_DETAILS environment variable controls whether users can access container logs directly through the interface.
Configure alerts per system under Settings → Systems → [System Name] → Alerts. Set thresholds for CPU percentage, memory usage, disk space, network bandwidth, temperature, or load average. Alerts support multiple conditions (all must be true or any can trigger) with configurable notification channels. Email alerts require SMTP configuration in hub settings. For webhook notifications, use Shoutrrr URL schemes supporting Discord, Slack, Telegram, Pushover, and 50+ services.
Multi-user workflows allow organizations to isolate system visibility by user. Admins create users and optionally share specific systems across multiple accounts. OAuth integration enables seamless SSO while the API provides programmatic access via PocketBase’s JavaScript or Dart SDKs for custom integrations.
Technical architecture: How Beszel achieves efficiency
Beszel’s lightweight nature stems from intelligent architectural choices. The agent uses gopsutil, a pure-Go cross-platform library requiring no CGO dependencies, to collect system metrics. This avoids the overhead of platform-specific binaries while maintaining sub-1% CPU utilization. Metrics are polled at fixed intervals and transmitted over persistent SSH or WebSocket connections with minimal protocol overhead.
The ED25519-based SSH implementation is deliberately constrained: no pseudo-terminal allocation, no command execution, no shell access. Even if an attacker compromises the hub’s private key, they cannot gain shell access to agents. Machine fingerprinting prevents agent cloning or migration attacks by binding registrations to unique hardware identifiers verified on every connection.
PocketBase provides a complete backend framework in a single embedded binary: SQLite database with Write-Ahead Logging for concurrency, RESTful API with real-time subscriptions, user authentication, file storage, and admin dashboard. This eliminates separate database servers (PostgreSQL, MySQL) and API layers (Express, Django) typical of monitoring stacks. The SQLite database scales vertically to thousands of monitored systems before hitting practical limits.
Data storage uses efficient time-series aggregation in SQLite tables. Raw metrics aggregate into 1-minute, 1-hour, and daily summaries to balance historical retention with storage efficiency. Automatic backup to S3-compatible storage (AWS S3, DigitalOcean Spaces, MinIO) protects against data loss. The embedded architecture means the entire monitoring platform—database, API, web UI, and backend logic—runs in a single process consuming under 100MB RAM.
Troubleshooting common Beszel issues
Agent won’t connect is the most frequent issue. First verify network connectivity with telnet agent-ip 45876 or test WebSocket endpoints in browser DevTools. Check firewall rules on both hub and agent systems—cloud providers often block ports by default in security groups. For Docker deployments where both hub and agent run on the same host, localhost doesn’t work due to network isolation; use a Unix socket instead by mounting a shared volume and setting the agent’s LISTEN to /beszel_socket/beszel.sock.
Fingerprint mismatch errors occur when using the same universal token for multiple systems or adding systems without browser refresh. Each monitored system needs a unique fingerprint. Generate a fresh token per system or ensure you refresh the browser between adding multiple systems so tokens rotate properly.
Docker memory stats showing zero indicates disabled cgroup memory accounting. Run docker stats to confirm—if memory shows zero, enable cgroups by adding cgroup_enable=cpuset cgroup_enable=memory to /boot/cmdline.txt on Raspberry Pi or equivalent kernel parameters on other systems. Rootless Docker requires additional cgroup CPU delegation configuration.
Real-time statistics not updating usually results from reverse proxy misconfiguration. Beszel uses Server-Sent Events for live updates, which break if gzip compression applies to text/event-stream content. Disable compression for this content type in Nginx, Caddy, or Apache. Ensure WebSocket support is properly configured with Upgrade and Connection headers for agent connections.
Windows-specific issues include diskstats access denied errors preventing EXTRA_FILESYSTEMS from working. Verify Windows Defender isn’t blocking file access and confirm drive letters match system configuration. Container memory stats don’t work on Windows Docker due to platform differences in how metrics are reported—this is a known limitation without workaround.
For GPU monitoring problems, ensure vendor tools (nvidia-smi, rocm-smi, intel_gpu_top) are installed and in the PATH. WSL2 requires special nvidia-smi configuration. GPU monitoring only works with binary agent installations, not Docker images (except the nvidia variant with NVIDIA Container Toolkit).
Beszel vs alternatives: Choosing the right tool
Beszel excels as the Goldilocks solution between simple uptime checkers and enterprise observability platforms. Compared to Uptime Kuma, Beszel provides comprehensive system metrics, historical data, and Docker monitoring beyond basic availability checks. Compared to Prometheus/Grafana, Beszel eliminates hours of YAML configuration, multiple service dependencies, and steep learning curves while maintaining good-enough monitoring for small-to-medium deployments.
Netdata offers deeper visibility into system internals with thousands of metrics and advanced anomaly detection, but the free tier limits monitoring to 5 nodes and consumes 2-4% CPU continuously. Beszel has no artificial limits, uses under 1% resources, and provides cleaner interfaces without overwhelming metric explosion. Users switching from Netdata cite “no commercial limitations” and “refreshingly simple” as key motivations.
Grafana with Prometheus remains superior for large-scale environments requiring custom queries (PromQL), complex dashboards, and extensive third-party integrations. Beszel doesn’t attempt to replace this enterprise standard—it serves users who find that stack overkill. The project targets 1-100 servers typical of homelabs, small businesses, and development teams rather than 1000+ server production environments.
Glances provides terminal-based monitoring excellent for interactive sessions but lacks persistent historical data and centralized multi-server views. Beszel’s web dashboard with historical graphs and alerting makes it better suited for continuous monitoring scenarios.
Project health and future outlook
Beszel demonstrates exceptional project momentum with 16,500+ stars accumulated in under a year and consistent bi-weekly releases. Recent updates introduced S.M.A.R.T. disk health monitoring (v0.15), MFA support (v0.14.1), universal tokens for simplified agent deployment (v0.12), and alpine Docker images. The developer actively responds to issues and merges community contributions including multilingual translations spanning 10+ languages.
The roadmap prioritizes refinement over feature bloat. Recent additions like per-interface network charts, battery monitoring, and CPU state details respond to user feedback while maintaining the core philosophy of simplicity. The single-maintainer model presents typical open-source sustainability questions, but the codebase’s simplicity and active contributor growth suggest healthy long-term viability.
Community engagement thrives through GitHub Discussions, a Matrix chat room, and integration into larger ecosystems. Third-party projects include Home Assistant integration, Proxmox helper scripts, and deployment guides for Coolify, TrueNAS, Synology, and OpenWRT. This organic ecosystem growth indicates genuine utility beyond initial hype.
Getting started with Beszel today
The fastest path to monitoring begins at the official documentation site (beszel.dev) where the Quick Start guide walks through Docker Compose deployment in under 5 minutes. Deploy the hub, create your admin account, generate an SSH key, then deploy agents using the pre-configured commands from the web UI. Most users achieve functional monitoring within 10 minutes—a stark contrast to the hours or days typical of enterprise monitoring stacks.
For homelab enthusiasts seeking lightweight server dashboard solutions, Beszel delivers on the promise of “simple, self-hosted monitoring” without sacrificing essential features. The MIT license, active development, and thriving community make Beszel a compelling choice for anyone monitoring more than a handful of systems but not ready for Prometheus complexity. Whether you’re tracking Docker containers across VPS fleets, monitoring rack servers in your basement, or keeping tabs on development environments, Beszel provides the sweet spot of capability and simplicity the monitoring landscape desperately needed.