In the modern web development landscape, uptime monitoring has evolved from a luxury to an absolute necessity. Whether you’re running a personal blog, managing critical API endpoints, or maintaining production services for clients, knowing when your infrastructure goes down—and being alerted immediately—can mean the difference between a minor hiccup and a major outage that damages your reputation and revenue.
Enter Uptime Kuma, a powerful, free, and open-source self-hosted monitoring tool that puts you in complete control of your monitoring infrastructure. Unlike commercial cloud-based alternatives like UptimeRobot or Pingdom, Uptime Kuma gives you full data ownership, unlimited monitors, and the flexibility to customize every aspect of your monitoring setup—all without recurring subscription fees or vendor lock-in.
In this comprehensive guide, you’ll learn everything you need to set up your own Uptime Kuma instance in under 30 minutes, configure multiple monitor types, set up intelligent notifications, and create beautiful status pages for your services.
What is Uptime Kuma?
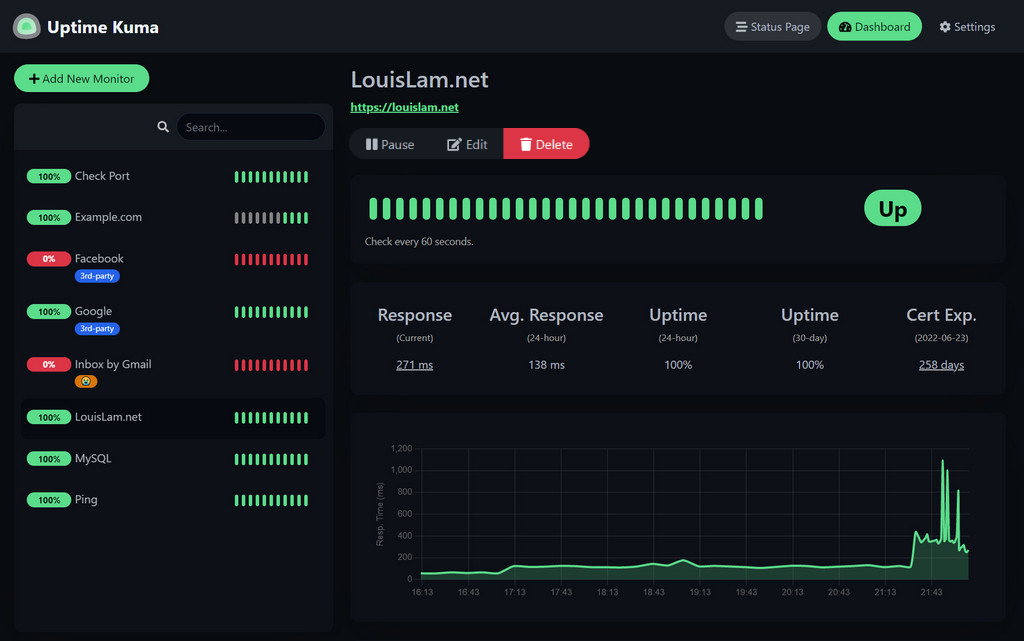
Uptime Kuma is a fancy self-hosted monitoring tool created by Louis Lam and hosted on GitHub, where it has garnered over 77,300 stars from the developer community. It’s designed as a lightweight alternative to commercial monitoring services, allowing developers and system administrators to monitor their websites, services, and infrastructure from their own servers.
Why Choose Uptime Kuma Over Commercial Alternatives?
The comparison between Uptime Kuma and commercial services like UptimeRobot reveals compelling advantages:
- Full Feature Access for Free: While UptimeRobot’s free tier limits you to 50 monitors with 5-minute check intervals, Uptime Kuma provides unlimited monitors with 20-second intervals at no cost.
- Complete Privacy & Data Ownership: Your monitoring data stays on your infrastructure. No third-party has access to your monitoring patterns, service endpoints, or incident history.
- Self-Hosted Control: You decide where it runs, how it’s configured, and who has access. Perfect for organizations with strict compliance requirements or those monitoring internal services.
- Modern, Responsive Interface: Unlike UptimeRobot’s outdated UI, Uptime Kuma features a fancy, reactive, and fast UI/UX built with Vue 3, providing a smooth monitoring experience.
- Advanced Features: Two-factor authentication, custom status pages mapped to specific domains, certificate expiration monitoring, proxy support, and multi-language support in 20+ languages.
Core Features That Make Uptime Kuma Stand Out
Uptime Kuma packs an impressive feature set that rivals—and often surpasses—commercial monitoring solutions:
Comprehensive Monitoring Types
Uptime Kuma supports a wide range of monitoring protocols to cover virtually any service you need to track:
- HTTP(s) Monitoring: Basic website uptime checks with response code validation
- HTTP(s) Keyword: Verify specific content appears on your pages
- HTTP(s) JSON Query: Monitor API endpoints and validate JSON responses
- TCP Port Monitoring: Check if specific services (SSH, databases, mail servers) are accessible
- Ping/ICMP: Monitor network connectivity and latency
- DNS Record Monitoring: Verify DNS resolution and record accuracy
- Docker Container Monitoring: Track the health of containerized applications
- Push Monitoring: Accept heartbeat signals from services behind NAT or firewalls
- Steam Game Server: Monitor gaming servers
- Database Monitoring: Check MySQL, PostgreSQL, and other database instances
Intelligent Notification System
With support for 90+ notification services, Uptime Kuma ensures you’re alerted through your preferred channels:
- Popular platforms: Telegram, Discord, Slack, Microsoft Teams, Pushover
- Email: SMTP support for custom email servers
- Webhooks: Integrate with n8n, Zapier, or custom automation workflows
- New in v2.0: Nextcloud Talk, Brevo, and Evolution APIyoutube
You can configure multiple notification channels per monitor, set retry thresholds to avoid false alarms, and customize alert messages with notification templates.
Beautiful Status Pages
Create public-facing status pages to keep your users informed during incidents:
- Multiple status pages per instance
- Map status pages to custom domains
- Group monitors by service categories
- Customize themes (light/dark/auto)
- Add custom CSS for brand alignment
- Create incident reports directly from the interface
Enterprise-Grade Capabilities
- 20-second monitoring intervals: Catch even brief outages
- SSL/TLS certificate monitoring: Get alerts before certificates expire
- Historical data & analytics: Response time graphs and uptime percentages
- Two-factor authentication: Secure your monitoring dashboard
- Proxy support: Monitor through SOCKS or HTTP proxies
- Multi-language interface: Available in 20+ languages
Prerequisites Before Installation
Before diving into the installation, ensure you have the following ready:
For Docker Installation (Recommended)
- A server or VPS running Linux (Ubuntu, Debian, CentOS, Fedora, or similar)
- Docker and Docker Compose installed
- Basic familiarity with command-line operations
- At least 512MB RAM and 1GB disk space (for small deployments with ~25 monitors)
- Port 3001 available (or your preferred port)
For Non-Docker Installation
- Node.js v20.4 or higher (latest LTS recommended)
- Git for cloning the repository
- PM2 process manager for running in the background
- Supported platforms: Major Linux distributions, Windows 10 (x64), Windows Server 2012 R2+
- Not supported: FreeBSD, OpenBSD, NetBSD, Replit, Heroku
Optional but Recommended
- A reverse proxy (Nginx, Caddy, or Traefik) for HTTPS access
- A domain name for professional status pages
- SSL certificate (Let’s Encrypt with Certbot is free and automated)
Installation Guide
Let’s walk through multiple installation methods so you can choose the one that best fits your infrastructure.
Method 1: Docker Compose Installation (Recommended)
Docker Compose is the simplest and most popular method for deploying Uptime Kuma. It provides consistent deployment across environments and makes updates effortless.
Step 1: Create the installation directory
mkdir uptime-kuma
cd uptime-kuma
Step 2: Download the official Docker Compose file
curl -o compose.yaml https://raw.githubusercontent.com/louislam/uptime-kuma/master/compose.yamlStep 3: Start Uptime Kuma
docker compose up -dUptime Kuma is now running on http://localhost:3001
Step 4: Access the web interface
Open your browser and navigate to http://YOUR-SERVER-IP:3001. You’ll be greeted with a setup wizard to create your admin account.
IMPORTANT NOTE:
The Docker volume stores all your monitoring data. Never use NFS (Network File System) for the data volume—map it to a local directory or Docker volume.
Method 2: Docker Run Command (Quick Start)
For a faster single-command deployment:
docker run -d --restart=always -p 3001:3001 -v uptime-kuma:/app/data --name uptime-kuma louislam/uptime-kuma:2To limit exposure to localhost only (recommended when using a reverse proxy):
docker run -d --restart=always -p 127.0.0.1:3001:3001 -v uptime-kuma:/app/data --name uptime-kuma louislam/uptime-kuma:2This configuration prevents external access and forces all traffic through your reverse proxy.
Method 3: Direct Node.js Installation
For those who prefer running Uptime Kuma without containers:
Step 1: Install Node.js v20.4+
# For Ubuntu/Debian
curl -fsSL https://deb.nodesource.com/setup_20.x | sudo -E bash -
sudo apt install -y nodejs
Step 2: Clone the repository
git clone https://github.com/louislam/uptime-kuma.git
cd uptime-kuma
npm run setup
Step 3: Install PM2 process manager
npm install pm2 -g && pm2 install pm2-logrotateStep 4: Start Uptime Kuma with PM2
pm2 start server/server.js --name uptime-kumaStep 5: Configure PM2 to start on boot
pm2 startup
pm2 save
Uptime Kuma is now accessible at http://localhost:3001
Useful PM2 commands:
pm2 monit              # Real-time monitoring
pm2 logs uptime-kuma   # View logs
pm2 restart uptime-kuma # Restart the service
pm2 stop uptime-kuma   # Stop the service
Setting Up a Reverse Proxy with Nginx
Running Uptime Kuma behind a reverse proxy provides HTTPS encryption, custom domains, and better security. Here’s how to configure Nginx as a reverse proxy.
Step 1: Install Nginx
sudo apt install nginx -yStep 2: Create Nginx configuration
sudo nano /etc/nginx/sites-available/uptime-kumaStep 3: Add the following configuration (replace status.yourdomain.com with your domain):
server {
    listen 80;
    server_name status.yourdomain.com;

    location / {
        proxy_pass http://localhost:3001;
        proxy_http_version 1.1;
        proxy_set_header Upgrade $http_upgrade;
        proxy_set_header Connection "upgrade";
        proxy_set_header Host $host;
        proxy_set_header X-Real-IP $remote_addr;
        proxy_set_header X-Forwarded-For $proxy_add_x_forwarded_for;
        proxy_set_header X-Forwarded-Proto $scheme;
    }
}
Step 4: Enable the configuration
sudo ln -s /etc/nginx/sites-available/uptime-kuma /etc/nginx/sites-enabled/
sudo nginx -t  # Test configuration
sudo systemctl restart nginx
Step 5: Install SSL with Let’s Encrypt
sudo apt install certbot python3-certbot-nginx -y
sudo certbot --nginx -d status.yourdomain.com
Certbot will automatically configure HTTPS and set up auto-renewal.
Common Reverse Proxy Issues:
- WebSocket Support Required: Uptime Kuma relies on WebSockets. Ensure
proxy_set_header UpgradeandConnection "upgrade"are configured. - Port Conflicts: If port 3001 is already in use, change the Docker port mapping (e.g.,
3002:3001).
Using Uptime Kuma: A Step-by-Step Guide
Now that Uptime Kuma is installed, let’s configure it to monitor your services effectively.
Adding Your First Monitor
Step 1: Create an admin account
On first access, Uptime Kuma presents a setup wizard. Choose your preferred language, enter a username and strong password.
Step 2: Add a new monitor
Click the “Add New Monitor” button in the dashboard.
Step 3: Configure the monitor
Let’s create an HTTP(s) monitor for a website:
- Monitor Type: HTTP(s)
- Friendly Name: My Blog Website
- URL: https://yourblog.com
- Heartbeat Interval: 60 seconds (how often to check)
- Retries: 3 (number of failures before alerting)
- Retry Interval: 60 seconds (time between retries)
Advanced HTTP Options:
- Accepted Status Codes: 200-299 (default)
- Keyword Monitoring: Check if specific text appears on the page
- Certificate Expiry Notification: Alert X days before SSL expires
- Ignore TLS/SSL Error: For self-signed certificates (not recommended for production)
Step 4: Save the monitor
Click “Save” and watch as Uptime Kuma begins monitoring immediately.
Monitoring Different Service Types
TCP Port Monitor (for SSH, databases, mail servers):
- Monitor Type: TCP Port
- Hostname: 192.168.1.100
- Port: 22 (SSH), 3306 (MySQL), 5432 (PostgreSQL)
- Heartbeat Interval: 60 seconds
Ping/ICMP Monitor (for network devices):
- Monitor Type: Ping
- Hostname: 192.168.1.1 (router IP)
- Heartbeat Interval: 60 seconds
Docker Container Monitor:
To monitor Docker containers, you need to mount the Docker socket:
docker run -d --restart=always -p 3001:3001 \
  -v uptime-kuma:/app/data \
  -v /var/run/docker.sock:/var/run/docker.sock \
  --name uptime-kuma louislam/uptime-kuma:2
Then select Docker Container as the monitor type and choose from your running containers.
Push Monitor (for services behind NAT):
This is perfect for monitoring servers that can’t be reached directly but have outgoing internet access.
- Monitor Type: Push
- Copy the generated Push URL
- Add it to a cron job on the target server:
# Cron job: check every minute
* * * * * /usr/bin/curl -s 'http://YOUR-UPTIME-KUMA:3001/api/push/TOKEN?msg=OK&ping='
Configuring Notifications
Notifications are crucial—they transform passive monitoring into active incident response.
Setting Up Email (SMTP) Notifications
Step 1: Open notification settings
Click your profile icon → Settings → Notifications → Setup Notification.
Step 2: Configure SMTP
- Notification Type: Email (SMTP)
- SMTP Host: smtp.gmail.com (for Gmail)
- SMTP Port: 587 (TLS) or 465 (SSL)
- Security: TLS/STARTTLS
- Username: [email protected]
- Password: Your app password (not your regular password)
- From Email: [email protected]
- To Email: [email protected]
For Gmail, you must create an App Password:
- Visit Google Account → Security
- Enable 2-Step Verification
- Generate an App Password for “Mail”
Step 3: Test the notification
Click “Test” to send a test alert. If successful, click “Save”.
Setting Up Discord Notifications
Step 1: Create a Discord webhook
In Discord:
- Server Settings → Integrations → Webhooks
- Click “Create Webhook”
- Choose the channel for alerts
- Copy the Webhook URL
Step 2: Configure in Uptime Kuma
- Notification Type: Discord
- Webhook URL: Paste your Discord webhook
- Bot Display Name: Uptime Kuma (optional)
- Click “Test” then “Save”
Setting Up Telegram Notifications
Step 1: Create a Telegram bot
- Message @BotFather in Telegram
- Send
/newbotand follow instructions - Copy your Bot Token
Step 2: Get your Chat ID
- Message your bot
- Visit:
https://api.telegram.org/bot<YOUR_BOT_TOKEN>/getUpdates - Look for
"chat":{"id":123456789}
Step 3: Configure in Uptime Kuma
- Notification Type: Telegram
- Bot Token: Your bot token
- Chat ID: Your chat ID
- Click “Test” then “Save”
Applying Notifications to Monitors
When creating or editing a monitor, scroll to the Notifications section and click “Setup Notification” to attach your configured notification channels.
You can attach multiple notification channels to a single monitor for redundancy.
Creating Public Status Pages
Status pages keep your users informed during outages and build trust by demonstrating transparency.
Step 1: Create a status page
Click “Status Pages” in the top-right menu → “Add New Status Page”.
Step 2: Configure basic settings
- Status Page Name: My Services Status
- Slug: my-services (appears in URL:
/status/my-services) - Description: Real-time status of our services
- Footer Text: © 2025 Your Company
Step 3: Add monitors to the status page
Select which monitors should appear on the public page. You can organize them into groups (e.g., “Website Services”, “API Endpoints”, “Infrastructure”).
Step 4: Customize appearance
- Theme: Light, Dark, or Auto (follows system preference)
- Show Ping Chart: Display response time graphs
- Show Certificate Info: Display SSL expiration
- Custom CSS: Brand the page with your colors and fonts
Example Custom CSS for branding:
:root {
    --primary: #0066cc;
    --surface: #ffffff;
    --text: #333333;
}

body {
    font-family: 'Inter', sans-serif;
}

.item {
    border-radius: 8px;
    box-shadow: 0 2px 4px rgba(0,0,0,0.1);
}
Step 5: Map to a custom domain (optional)
In Settings → General → Status Page Domain, you can map specific status pages to custom domains or subdomains.
Step 6: Publish and share
Your status page is now live at http://your-domain:3001/status/my-services. Share this URL with users, embed it in your website, or link it from your documentation.
Pro Tip: Set one status page as your default Entry Page in Settings → General → Entry Page, so visitors see the status page when accessing your Uptime Kuma domain without logging in.
Troubleshooting Common Issues
Issue: “Connection Refused” or Monitors Show Down
Cause: Docker networking or firewall issues.
Solution: Test connectivity from inside the container:
docker exec -it uptime-kuma bash
apt update && apt install -y curl
curl https://google.com
ping google.com
If these fail, check your Docker network configuration or firewall rules.
Issue: Port 3001 Already in Use
Cause: Another service is using port 3001.
Solution: Change the host port mapping:
docker run -d --restart=always -p 3002:3001 -v uptime-kuma:/app/data --name uptime-kuma louislam/uptime-kuma:2Now access Uptime Kuma on port 3002.
Issue: Reverse Proxy Shows “Bad Gateway”
Cause: WebSocket support not configured.
Solution: Ensure your Nginx config includes:
proxy_http_version 1.1;
proxy_set_header Upgrade $http_upgrade;
proxy_set_header Connection "upgrade";
Restart Nginx: sudo systemctl restart nginx.
Issue: False Downtime Alerts for Working Services
Cause: Network instability or overly aggressive retry settings.
Solution:
- Increase Retries to 5-10 before alerting
- Check your server’s internet connection stability
- Try increasing Heartbeat Interval to reduce load
Issue: High CPU or Memory Usage
Cause: Too many monitors with aggressive check intervals.
Solution:
- Increase heartbeat intervals (e.g., 120s instead of 20s)
- Consider MariaDB instead of SQLite for deployments with 100+ monitors
- Upgrade server resources (2GB RAM for large deployments)
Updating Uptime Kuma
Keeping Uptime Kuma updated ensures you benefit from the latest features, performance improvements, and security patches.
For Docker Installations
cd uptime-kuma
docker compose pull
docker compose up -d
Your data is preserved in the Docker volume.
For Node.js Installations
cd uptime-kuma
git fetch --all
git checkout 2.0.2  # Replace with latest version
npm install
npm run build
pm2 restart uptime-kuma
Always check the release notes for breaking changes, especially when upgrading to major versions like 2.0.
Community Resources and Getting Help
Uptime Kuma has a vibrant, helpful community ready to assist:
- GitHub Repository: https://github.com/louislam/uptime-kuma (77.3K+ stars)
- Official Documentation: https://github.com/louislam/uptime-kuma/wiki
- Subreddit: r/UptimeKuma for community discussions
- GitHub Issues: Report bugs or request features
- Live Demo: Try before installing at https://demo.kuma.pet/start-demogithub
IMPORTANT:
The maintainer Louis Lam (u/louislamlam on Reddit) prefers GitHub Issues and the subreddit for support. Avoid sending direct emails for technical questions.
Conclusion: Take Control of Your Monitoring
Uptime Kuma represents a paradigm shift in uptime monitoring—it proves that self-hosted solutions can match or exceed commercial offerings while giving you complete control over your data, privacy, and costs. With its modern interface, comprehensive monitoring capabilities, and extensive notification options, it’s the perfect choice for developers, DevOps engineers, and system administrators who value autonomy and transparency.
Key Takeaways
- Free forever with unlimited monitors and 20-second check intervals
- 90+ notification services including Telegram, Discord, Slack, and email
- Multiple deployment options: Docker, Node.js, with or without reverse proxy
- Beautiful status pages with custom domains and branding
- Active development with 793 contributors and regular updates
- Privacy-focused: Your data stays on your infrastructure
Next Steps
- Start with Docker Compose for the easiest deployment experience
- Monitor 3-5 critical services initially to get comfortable with the interface
- Set up at least two notification channels for redundancy (e.g., Email + Discord)
- Create a public status page to demonstrate transparency to users
- Join the community on GitHub or Reddit to stay updated on new features
Whether you’re monitoring a personal homelab with a few services or managing critical infrastructure for a business, Uptime Kuma scales to meet your needs. The 30 minutes you invest in setting it up today will save you countless hours of downtime troubleshooting in the future.
Ready to take control of your uptime monitoring? Clone the repository, spin up a Docker container, and experience the peace of mind that comes with knowing exactly when—and why—your services go down.
Useful Links:
- GitHub Repository: https://github.com/louislam/uptime-kuma
- Official Wiki: https://github.com/louislam/uptime-kuma/wiki
- Live Demo: https://demo.kuma.pet/start-demo
- Community Subreddit: https://reddit.com/r/UptimeKuma