GraphPad Prism – Data management, organization & analysis tools
The preferred analysis and graphing solution purpose-built for scientific research. Join the world’s leading scientists and discover how you can use Prism to save time, make more appropriate analysis choices, and elegantly graph and present your scientific research.
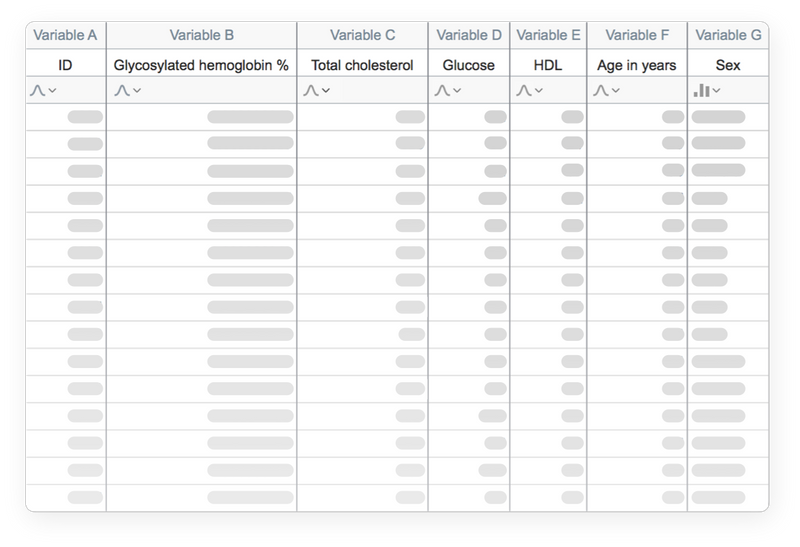
Organize Your Data Effectively
Prism is specifically formatted for the analyses you want to run, including analysis of quantitative and categorical data. This makes it easier to enter data correctly, choose suitable analyses, and create stunning graphs.
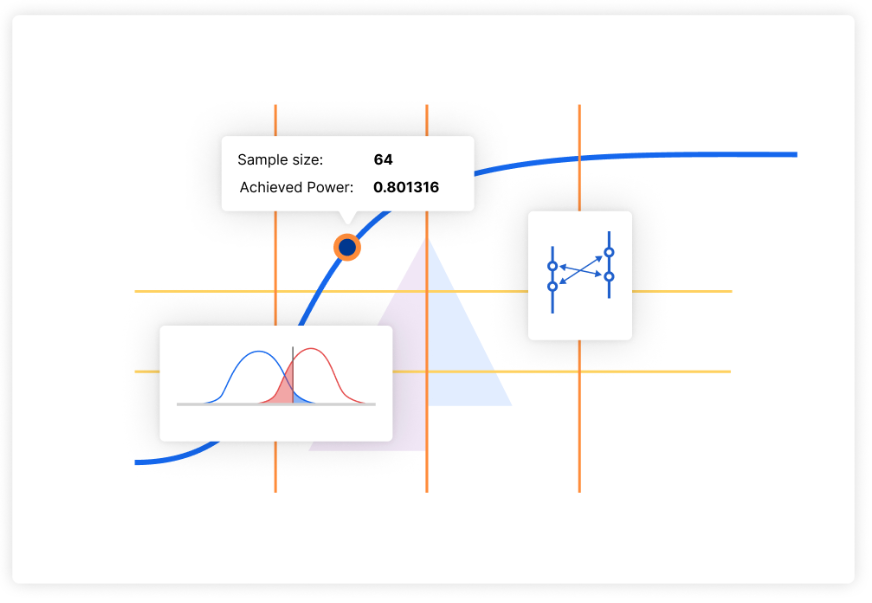
Sample Size and Power Analysis
Optimize your experiments from the start by accurately determining the necessary sample size for your predicted effect, or investigate the smallest effect you can detect given a limited sample size.
Streamline your research process, conserve valuable resources, and boost the reliability of your findings.
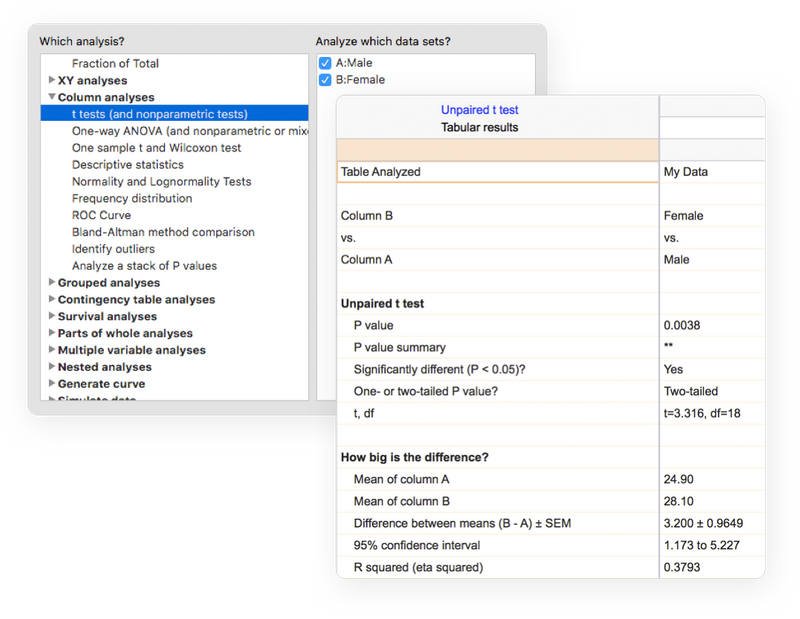
Perform The Right Analysis
Avoid statistical jargon. In clear language, Prism presents an extensive library of analyses from common to highly specific— t tests, one-, two- and three-way ANOVA,linear and nonlinear regression dose-response curves, binary logistic regression, survival analysis, principal component analysis, and much more. Each analysis has a checklist to help you understand the required statistical assumptions and confirm you have selected an appropriate test.
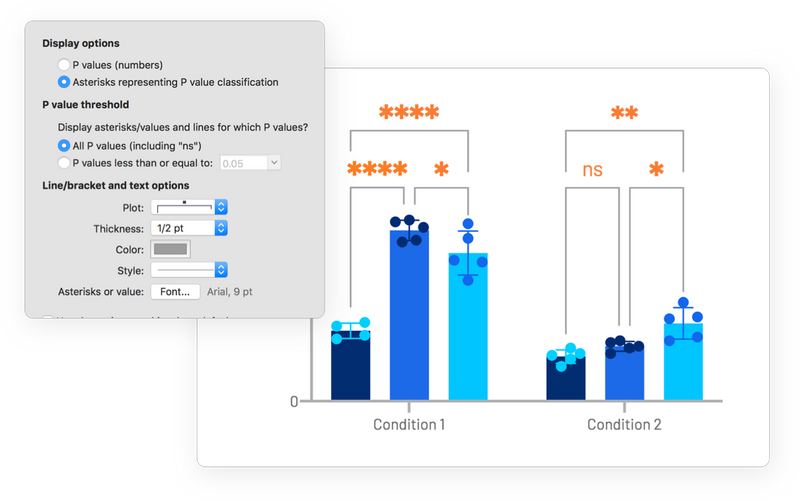
Automate Your Work Without Programming
Automatically add multiple pairwise comparisons to your analysis with a single click. For customization options of these lines and asterisks, simply click the toolbar button again. Make adjustments to the data or the analysis, and the results displayed on the graph will update automatically.
Download
- Graphpad Prism v10.4.1.dmg | Backup | Backup2
- Graphpad Prism v10.3.1.dmg | OneDrive | Backup | Backup2
- Graphpad Prism v10.3.0.dmg | OneDrive | Backup | Backup2
- Graphpad Prism v10.2.3.dmg | OneDrive | Backup | Backup2
- Graphpad Prism v10.2.1.dmg | OneDrive | Backup | Backup2
- Graphpad Prism v10.2.0.dmg | OneDrive | Backup | Backup2