In the previous article, we walked through the process of installing Uptime Kuma in a Home Lab setup. Now, let’s focus on another indispensable tool for monitoring system performance – Netdata.
What is Netdata?
Netdata is a powerful, real-time monitoring and performance visualization tool designed for system administrators, DevOps engineers, and tech enthusiasts managing infrastructure. It offers insights into system health, application performance, and network activity.
Key Features:
- Real-time Monitoring: Tracks metrics in real-time with second-by-second updates.
- Interactive Web Interface: Provides an intuitive dashboard for analyzing metrics.
- Autodiscovery: Automatically detects services, containers, and VMs for monitoring.
- Customizable Alerts: Configure alarms for critical metrics.
- Lightweight: Consumes minimal resources, ensuring efficient performance.
- Extensible: Easily integrates with other tools in your stack.
With its rich features, Netdata helps maintain system reliability and detect potential issues before they escalate.
Installation Methods
We’ll explore two installation approaches for Netdata:
- Direct installation on a Proxmox node
- Deployment via Docker Compose in a Proxmox LXC
Method 1: Direct Installation on Proxmox
Installing Netdata directly on a Proxmox node enables it to monitor Proxmox resources, including LXCs, VMs, and the host itself.
Step 1: Log into Proxmox
- Open your Proxmox web interface.
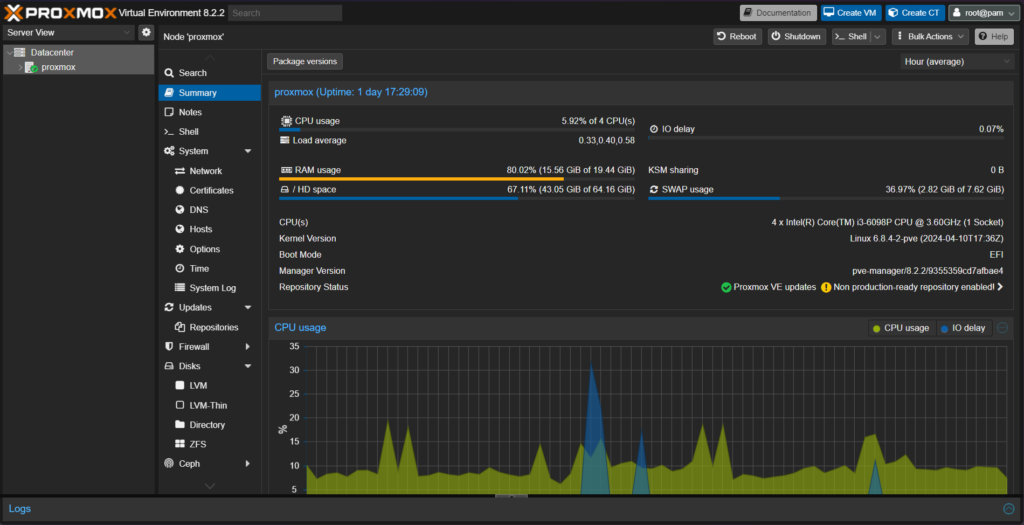
- Navigate to your desired Proxmox node and click the Shell option.
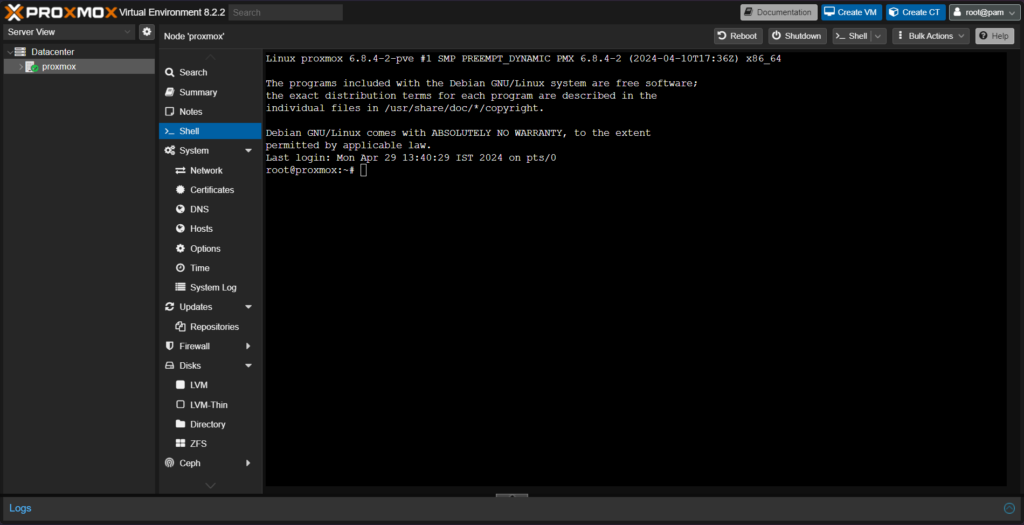
Step 2: Download and Execute the Netdata Script
Run the following command in the shell:
wget -O /tmp/netdata-kickstart.sh https://get.netdata.cloud/kickstart.sh && sh /tmp/netdata-kickstart.sh --stable-channel --disable-telemetry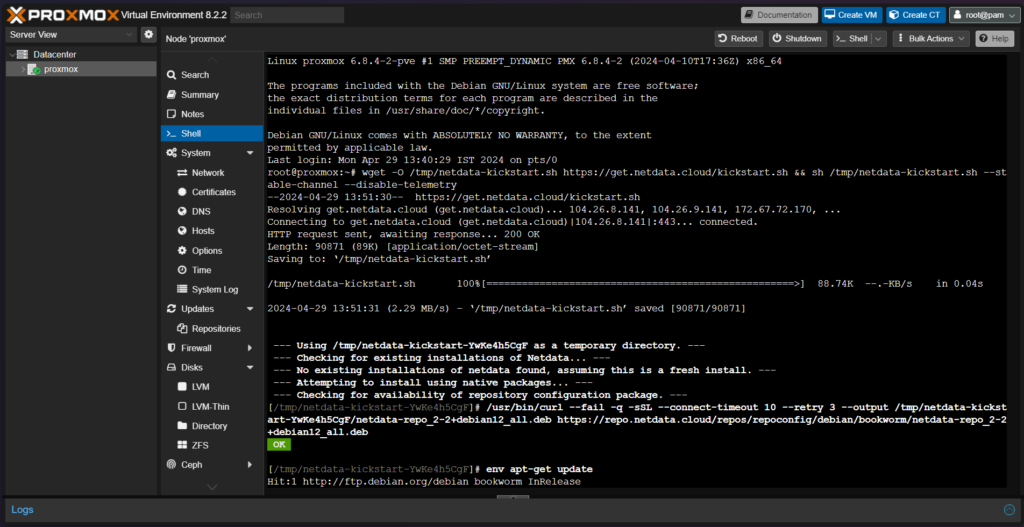
- The script will handle downloading and installing Netdata.
- Respond to any prompts by typing Y and pressing Enter.
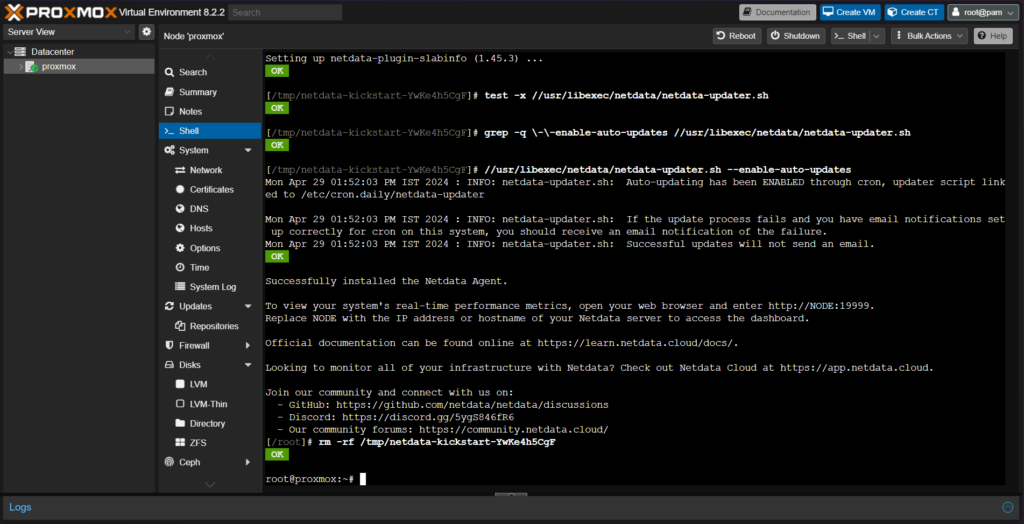
Step 3: Access the Netdata Dashboard
Once installed, the Netdata instance runs on port 19999 by default. Open your browser and navigate to:
http://<Proxmox-IP>:19999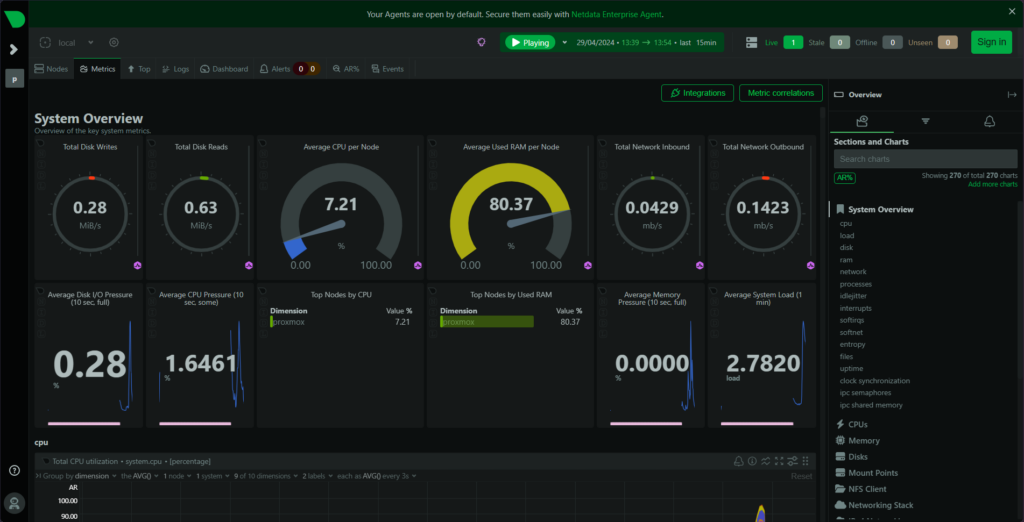
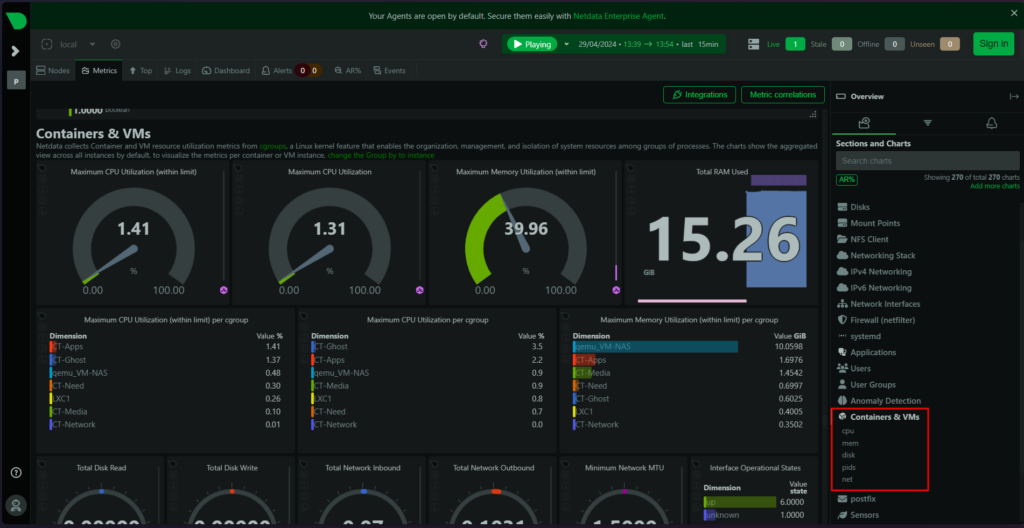
You’ll be greeted with an interactive dashboard displaying real-time metrics, including:
- CPU usage
- Memory utilization
- Disk activity
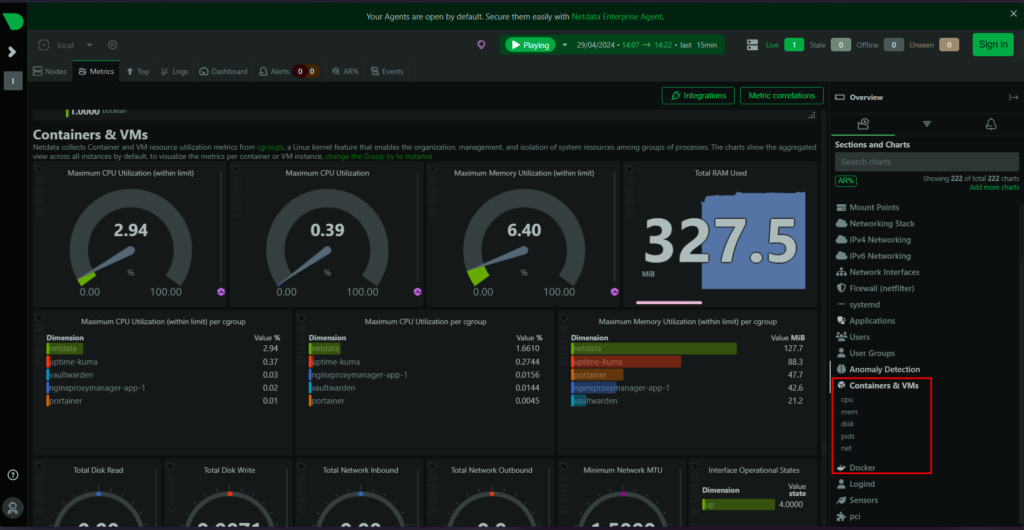
- Container and VM stats (autodetected by Netdata)
Method 2: Installing Netdata via Docker Compose
This approach deploys Netdata in a containerized environment within a Proxmox LXC. It’s a great option for isolating monitoring tools.
Step 1: Prepare the Proxmox LXC
- Create an LXC container on your Proxmox node.
- Ensure Docker and Portainer are installed in the LXC.
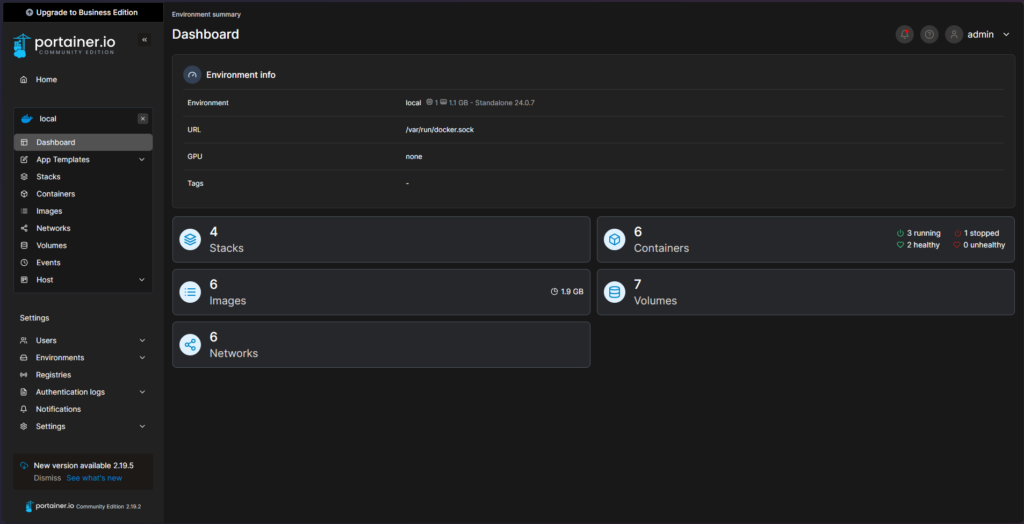
Step 2: Access Portainer
- Log into your Portainer instance.
- Select the local Docker environment.
Step 3: Deploy Netdata with Docker Compose
- Navigate to Stacks in Portainer and click Add Stack.
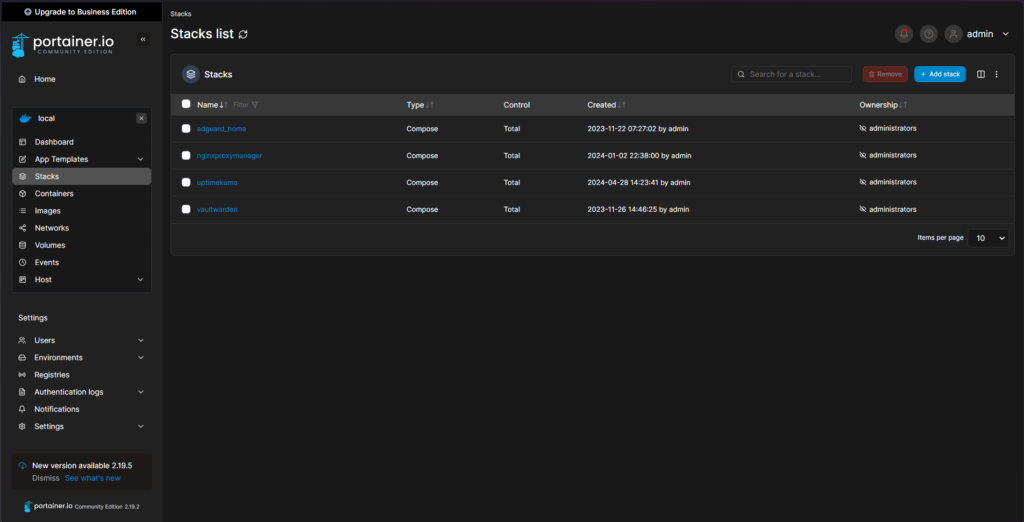
- Enter a name for the stack (e.g., netdata) and paste the following Docker Compose file:
version: '3'
services:
  netdata:
    image: netdata/netdata
    container_name: netdata
    pid: host
    network_mode: host
    restart: unless-stopped
    cap_add:
      - SYS_PTRACE
      - SYS_ADMIN
    security_opt:
      - apparmor:unconfined
    volumes:
      - netdataconfig:/etc/netdata
      - netdatalib:/var/lib/netdata
      - netdatacache:/var/cache/netdata
      - /etc/passwd:/host/etc/passwd:ro
      - /etc/group:/host/etc/group:ro
      - /etc/localtime:/etc/localtime:ro
      - /proc:/host/proc:ro
      - /sys:/host/sys:ro
      - /etc/os-release:/host/etc/os-release:ro
      - /var/log:/host/var/log:ro
      - /var/run/docker.sock:/var/run/docker.sock:ro
      - /run/dbus:/run/dbus:ro

volumes:
  netdataconfig:
  netdatalib:
  netdatacache: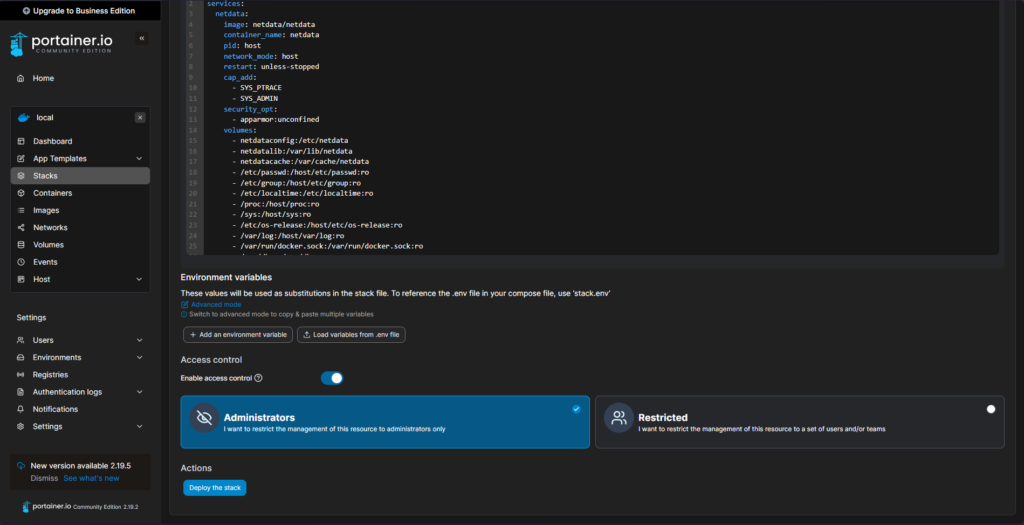
- Click Deploy the Stack.
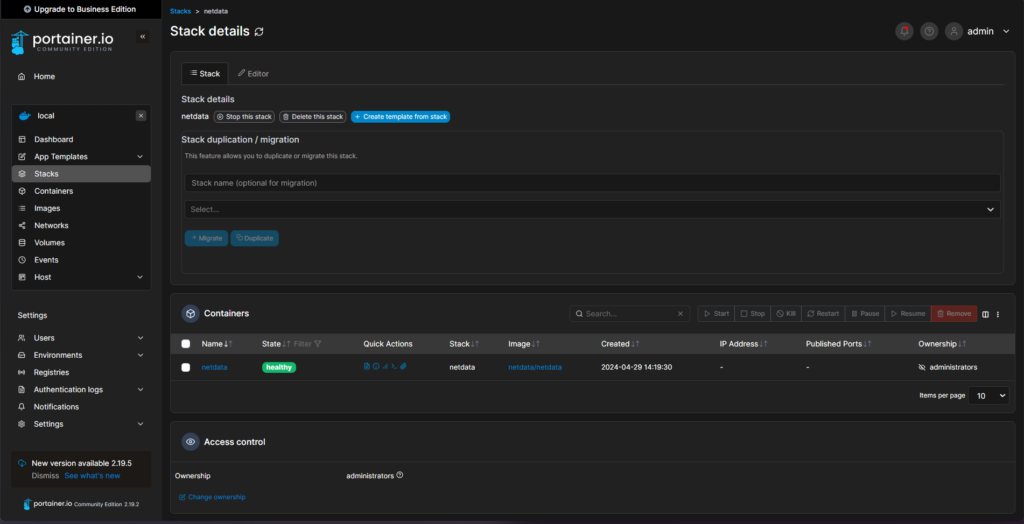
Step 4: Access the Dashboard
Once the stack is deployed, access Netdata by visiting:
http://<LXC-IP>:19999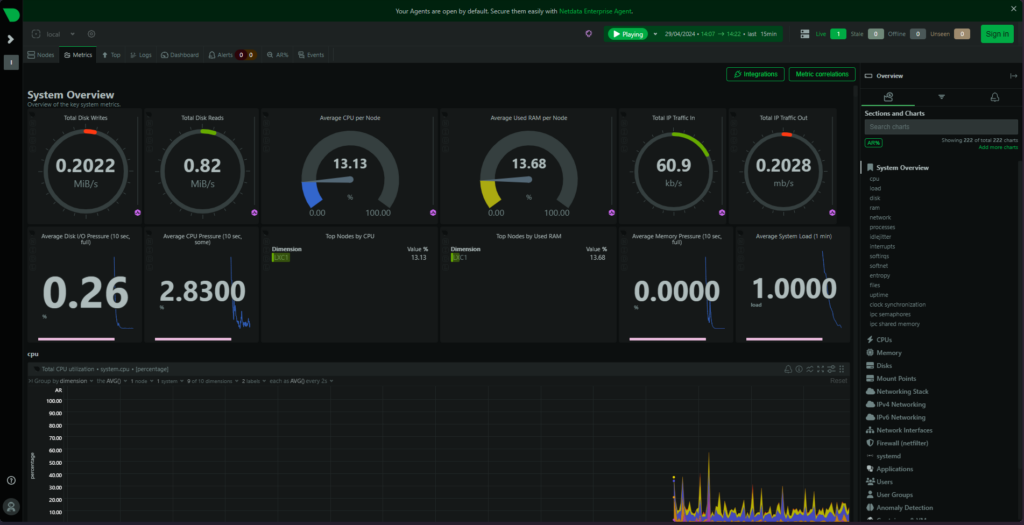
Netdata will monitor Docker containers and other metrics specific to the LXC.
Advantages of Each Method
| Direct Install | Docker Compose Install |
|---|---|
| Directly monitors Proxmox resources, LXCs, and VMs. | Ideal for monitoring containerized services. |
| Utilizes Proxmox’s full capabilities. | Isolates Netdata for easier management. |
| May require more system permissions. | Lightweight and containerized. |
Wrapping Up
By installing Netdata, you’ve added a powerful tool to your Home Lab, enabling real-time monitoring and enhanced system visibility. Whether you choose direct installation or a Docker deployment, Netdata will help you maintain system health and detect issues proactively.
In the next article, we’ll explore another tool to expand your Home Lab’s capabilities. Stay tuned!
Happy Home Labbing!

