Key Takeaways: Graphify turns any folder of code, docs, and media into a living knowledge graph so AI coding agents can answer deep, cross‑file questions with real structure instead of blind greps.
What is Graphify?
Graphify is an open‑source knowledge graph engine built for developers and AI assistants: point it at a folder and it turns your code, documentation, papers, design notes, images, and even meeting transcripts into a single, traversable graph of nodes and edges.
Instead of treating context as a flat list of files, Graphify builds a structured representation of how everything in your project connects—functions to APIs, APIs to database tables, tables to business rules in docs, and decisions buried in meeting notes—then exposes that graph to AI coding agents and tools like Claude Code, Cursor, Copilot CLI, Gemini CLI, and more.
You can explore Graphify here:
- Official repo: https://github.com/Graphify-Labs/graphify
- Product site: https://graphifylabs.ai/
Why Graphify matters for AI coding agents
Modern AI coding tools are powerful, but they operate on raw files and short‑lived context windows: every query forces them to re‑read code and doc fragments and guess relationships on the fly.
Graphify fixes that by adding a persistent, structured context layer:
- True project‑wide memory: Graphify ingests code, docs, schemas, notes, images, and video transcripts, then builds a unified graph that captures entities and relationships across all of them.
- Fewer tokens, cheaper queries: Because the graph encodes relationships directly, AI assistants query nodes and paths instead of streaming entire files, cutting token usage dramatically compared to raw context RAG setups.
- Incremental updates, no full rebuilds: When your project changes, Graphify patches only affected nodes and edges instead of re‑embedding the entire corpus, so the graph stays up‑to‑date even at monorepo scale.
- Confidence‑tagged relationships: Connections are tagged as extracted, inferred, or ambiguous, so humans and agents know which paths are grounded in hard code analysis versus semantics.
In practice, this turns “How does the login form connect to the users table?” from a multi‑file grep into a single structured query against a graph that already knows the answer.
How Graphify works (high level)
Graphify uses a multi‑pass architecture to combine deterministic code understanding with semantic extraction.
Multimodal ingestion
Graphify can process:
- Source code across dozens of languages via tree‑sitter (Python, TypeScript, Go, Rust, Java, C/C++, Swift, Kotlin, and more).
- Database schemas (SQL), scripts, and configuration files.
- Markdown, HTML, PDFs, and other docs.
- Images, audio, and video (via vision and transcription models) for meeting recordings, tutorials, and diagrams.
Each artifact becomes nodes and edges: functions, classes, tables, config entries, document sections, slides, and transcript segments are all represented in the same graph.
Graph construction and clustering
Once ingested, Graphify:
- Builds a knowledge graph with entities (nodes) and relationships (edges).
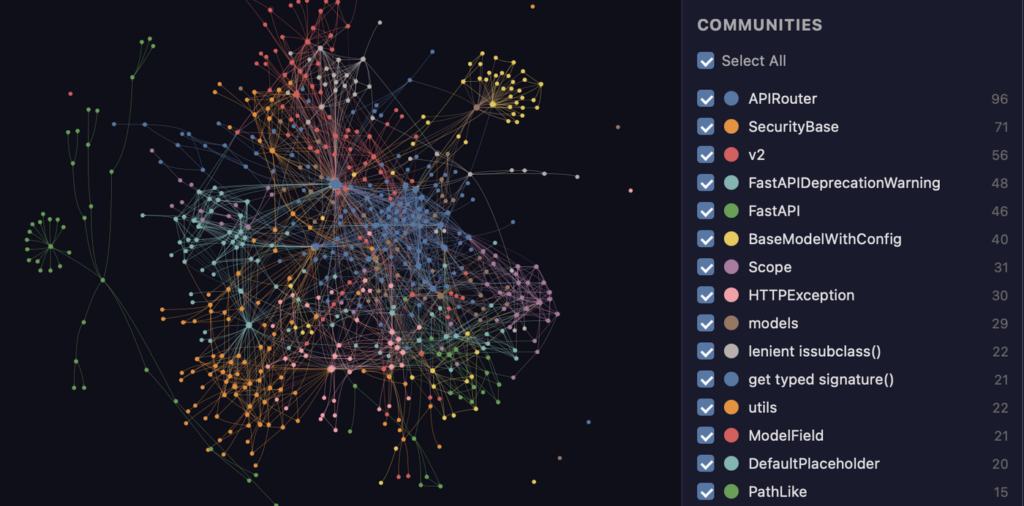
- Applies Leiden clustering to surface communities—logical subsystems, feature sets, or architectural slices.
- Identifies “god nodes” (high betweenness centrality) that connect many communities and represent critical files or functions whose changes have wide blast radius.
The result is an interactive structure: you can visually explore it via graph.html, read a human‑friendly highlight report, or let AI agents traverse paths to answer architectural questions.
Installing Graphify
Graphify is distributed primarily as a Python package (graphifyy) with optional Rust tooling (graphify-rs) for fast local graph builds.
Install via pip or uv (Python)
On macOS, Linux, or Windows with Python available:
pip install graphifyy
# or, using uv (recommended for speed and isolation)
uv tool install graphifyy
This installs the graphify/graphifyy CLI and supporting modules.
Once installed, you can confirm with:
graphify --helpThis prints available subcommands like build, watch, query, and export options.
Install the Rust CLI (graphify-rs)
If you prefer a pure Rust implementation or want ultra‑fast local builds, use graphify-rs from crates.io:
cargo install graphify-rsThen run:
graphify-rs build --no-llmThis command builds a knowledge graph without calling any LLM APIs, storing outputs under ~/.graphify-rs/<project>-<hash>/, including an interactive graph.html you can open in your browser.
Building your first graph with Graphify
Once Graphify is installed, creating a knowledge graph from a project folder is just a single command.
Step 1: Point Graphify at a folder
From the root of your project (monorepo, service, or notes vault):
graphify . # or: graphifyy build .Graphify will:
- Walk the directory tree and ingest supported file types.
- Parse code via tree‑sitter into ASTs and extract symbols and relationships.
- Process docs, PDFs, and media into semantic nodes.
- Write outputs into a
graphify-out/directory.
Typical outputs include:
graph.html– interactive visualization of the knowledge graph (clusters, nodes, edges).GRAPH_REPORT.md– a markdown report with key clusters, god nodes, and surprising connections.graph.json– machine‑readable graph suitable for tools and agents.
You can commit graphify-out/ to your repo so teammates and AI assistants share the same structured context.
Step 2: Explore the graph
Open the visual graph:
open graphify-out/graph.html
# or on Linux:
xdg-open graphify-out/graph.html
You’ll see clusters of nodes representing subsystems, connected by edges that capture function calls, imports, references, and semantic links.
This is where linking to illustrative figures makes sense; for example:
- General network graph visual:
Use GRAPH_REPORT.md to skim highlights like “auth subsystem,” “data pipeline cluster,” and “payment god nodes.”
Keeping the graph fresh: Watch mode
Static graphs go stale quickly, especially in active repos. Graphify’s watcher keeps yours synchronized.
From your project root:
graphify watch .The watcher:
- Detects file changes via filesystem events.
- Re‑extracts ASTs and semantics only for changed files.
- Patches impacted nodes and edges while leaving the rest of the graph intact.
This incremental patching is a key feature: instead of rebuilding embeddings or reindexing entire corpora, Graphify updates just what changed, making it viable for million‑file corpora and large organizations.
Querying relationships and paths
Once a graph exists, you can query it directly instead of grepping through files.
Examples:
graphify query "What connects the login form to the users table?"Graphify might return a path like:
LoginForm → /api/auth/login → AuthService.authenticate() → UserRepository.find_by_email() → users tableYou can then export a callflow diagram:
graphify export callflow-html --query "login flow to users table"This generates an HTML diagram (often in Mermaid or similar), which you can embed in docs or share with teammates.
For architectural investigations, queries like:
- “Show god nodes in the payments cluster.”
- “List PRs touching the same community as
BillingService.”
help you understand blast radius and review risk before merging changes.
Using Graphify with AI coding assistants
Graphify is built as a skill for AI coding agents.
In tools like Claude Code, Cursor, Copilot CLI, Gemini CLI, and similar:
- Run
/graphify .(or equivalent skill command) from within your project. - Wait for Graphify to ingest the project and build
graphify-out/. - Ask questions like:
- “Trace the path from
checkout()to theorderstable.” - “What are the top three god nodes by betweenness centrality?”
- “Which modules are tightly coupled with the auth subsystem?”
The assistant uses Graphify’s graph as structured context, so it can reason over relationships instead of re‑reading raw files every time.
Teams benefit because once one person runs Graphify and commits the outputs, every assistant—regardless of platform—can tap into the same graph without extra setup.
Practical workflows Graphify unlocks
Because you’re already comfortable with agents, self‑hosted tooling, and automation, Graphify slips neatly into your stack.
Some impactful workflows:
- Onboarding new engineers: Instead of three weeks of grepping and Slack questions, newcomers get a graph, a report, and path‑aware queries that explain systems and decisions quickly.
- PR triage and impact analysis: Use Graphify to rank PRs by graph impact and flag conflicts where multiple PRs touch the same communities, reducing merge‑order risk.
- Refactor planning: Surface god nodes and tightly coupled clusters before major rewrites, then track how graph structure changes as you decouple systems.
- Research and note mapping: Drop papers, notes, and transcripts into a folder, run Graphify, and query conceptual relationships instead of hunting manually.
Because Graphify runs on‑device and is MIT‑licensed, you can integrate it with self‑hosted LLMs, air‑gapped environments, and CI pipelines without adding new external dependencies.