Key Takeaways: OpenClaw-bot-review gives OpenClaw operators a lightweight, self-hosted dashboard for real-time bot tracking, model visibility, session monitoring, and gateway awareness without adding a database or heavy observability stack.
Why OpenClaw Needs a Centralized Monitoring Layer
Running one OpenClaw instance is manageable from the CLI, logs, and local config files. Running several OpenClaw bots across Discord, Feishu, cron jobs, and direct-message sessions is a different story. Once multiple agents, models, and channels are active at the same time, operational visibility starts to fragment. You stop asking whether OpenClaw works in general and start asking more specific questions: which bot is mapped to which model, which sessions are active, whether gateway health is stable, and where token usage is climbing.
That is the problem OpenClaw-bot-review is built to solve. It is a self-hosted dashboard focused on AI agent monitoring for the OpenClaw ecosystem. Instead of introducing another database, another telemetry collector, or another hosted admin panel, it reads directly from your local OpenClaw configuration and session data. The result is a simple control surface for real-time bot tracking that helps developers and self-hosters manage growing OpenClaw deployments with less guesswork.
What OpenClaw-bot-review Actually Provides
OpenClaw-bot-review is a lightweight web UI built with Next.js, TypeScript, and Tailwind CSS. Its value is not just that it displays data, but that it organizes OpenClaw operational state into views that are useful during day-to-day management.
Bot overview
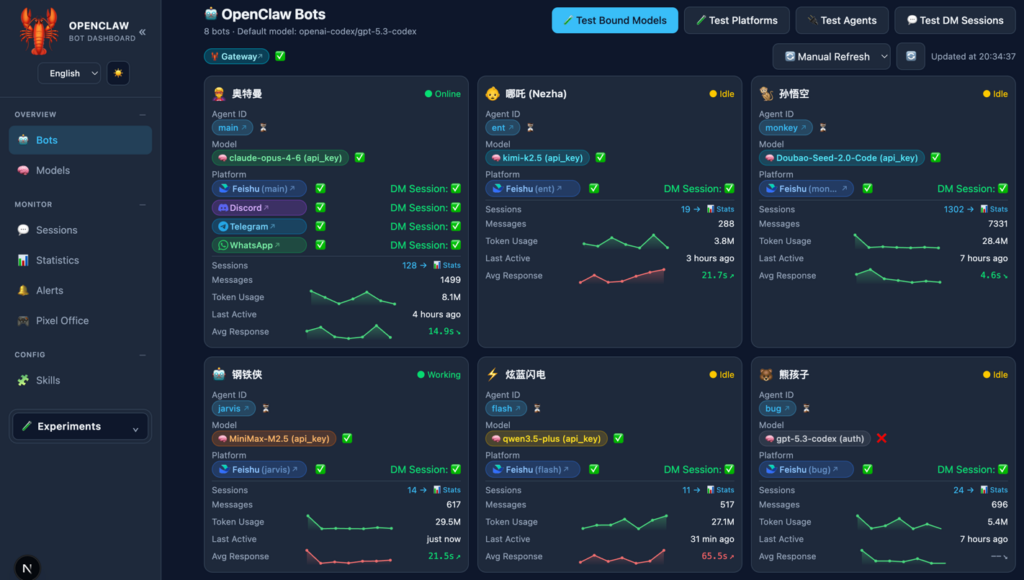
The main dashboard presents a card-based overview of agents, including bot name, emoji, model assignment, platform bindings, session counts, and gateway health. For teams operating several OpenClaw bots, this is the fastest way to understand the state of the system at a glance.
Model visibility
The model list shows configured providers and models, including context-window and output details, plus reasoning support where available. That makes the dashboard useful for validating model inventory, checking whether the right model is attached to the right workload, and supporting AI agent monitoring from the model layer upward.
Session management
The session view helps operators inspect sessions per agent with type detection for DM, group, and cron contexts. It also surfaces token usage and connectivity testing, which is especially useful when troubleshooting agent behavior that looks healthy in logs but is failing in a specific platform workflow.
Statistics and operations views
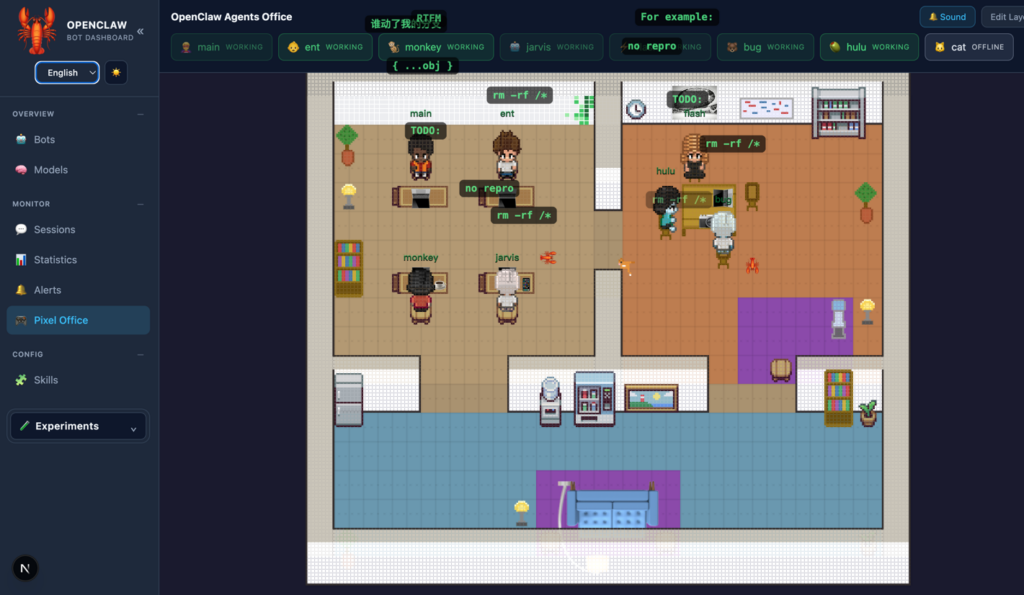
The project includes message statistics, average response-time trends, skill management, alerting, platform tests, configurable auto-refresh, dark and light themes, and bilingual UI support. There is also a pixel-office visualization that turns agents into animated characters. That feature is fun, but it also reinforces the core point of the product: making active OpenClaw systems easier to observe continuously.
Local Installation with Node.js and pnpm
The repository documents a standard local install flow with Node.js 18+ and typical Next.js scripts. Although the README examples use npm, the project structure is simple enough for pnpm-based teams that prefer a faster and more reproducible package manager.
Option 1: clone and run locally
git clone https://github.com/xmanrui/OpenClaw-bot-review.git
cd OpenClaw-bot-review
pnpm install
pnpm dev
If you prefer to match the repository examples exactly, you can use npm install and npm run dev or npm run start. The project scripts exposed in package.json are:
pnpm build
pnpm start
By default, the dashboard is served on http://localhost:3000.
What the local install expects
The main requirement is not a cloud account or external monitoring backend. It expects a working OpenClaw installation and access to OpenClaw runtime files, especially the configuration under ~/.openclaw/openclaw.json. This is a practical design choice: the dashboard stays lightweight because it reads live local state rather than mirroring it into a separate datastore.
Docker Deployment for Self-Hosted Environments
For operators standardizing on containers, Docker is the cleaner path. The repository provides a straightforward build-and-run pattern.
Build the image
docker build -t openclaw-dashboard .Run the container
docker run -d -p 3000:3000 openclaw-dashboardRun with a custom OpenClaw path mounted in
docker run -d \
  --name openclaw-dashboard \
  -p 3000:3000 \
  -e OPENCLAW_HOME=/opt/openclaw \
  -v /path/to/openclaw:/opt/openclaw \
  openclaw-dashboard
This pattern is the important part for self-hosted dashboard deployment. The application needs filesystem-level access to the OpenClaw home it should inspect. In other words, the connection to your OpenClaw instances is primarily established by exposing the right OpenClaw directory and setting the correct environment variable, not by wiring the dashboard to a separate external database.
How to Connect the Dashboard to Existing OpenClaw Instances
This is where many operators overcomplicate the setup. OpenClaw-bot-review is not presented as a remote SaaS control plane. It is a local or self-hosted dashboard that reads OpenClaw configuration and session files directly.
The key connection variable: OPENCLAW_HOME
If your OpenClaw runtime lives in the default path, the dashboard reads from ~/.openclaw/openclaw.json. If not, set:
OPENCLAW_HOME=/opt/openclawThis tells the dashboard where to find the OpenClaw configuration and local runtime artifacts.
API keys and endpoints in practice
The dashboard itself is not described as requiring a dedicated dashboard API key. Instead, it reflects the agents, providers, platforms, and session information already defined in your OpenClaw configuration. That means any model API keys, platform bindings, gateway endpoints, or plugin settings should already exist in the underlying OpenClaw instance you point it at. The dashboard becomes an observability layer over that configured instance.
For a single host, the cleanest approach is to run OpenClaw and OpenClaw-bot-review on the same machine or mount the same OpenClaw home directory into the container. For multiple instances, teams will typically centralize or selectively expose the instance data they want the dashboard to read, while keeping secrets managed at the OpenClaw layer.
Usage and Best Practices for Daily Operations
Once the dashboard is running, treat it as an operations console rather than a replacement for deeper debugging.
Start with the bot cards
The bot overview is the fastest health check. Look for model mismatches, disconnected platforms, abnormal session counts, or unhealthy gateway indicators before opening any individual session.
Use session views for targeted troubleshooting
If a specific agent appears unstable, move into the session management view to compare DM, group, and cron sessions. This helps isolate whether the issue is broad or bound to one platform workflow.
Watch trends, not just incidents
The statistics panels are useful because AI agent monitoring is often about drift rather than sudden failure. Rising token usage, slower average response times, or repeated connectivity test failures usually indicate a problem before users report one.
Keep the stack lightweight on purpose
One of the strongest ideas in OpenClaw-bot-review is that a self-hosted dashboard does not have to become another infrastructure burden. Because it reads local config and session files directly, it fits well for small teams, solo operators, and home-lab OpenClaw deployments that want real-time bot tracking without building a full observability pipeline.
Why This Project Matters in the OpenClaw Ecosystem
OpenClaw-bot-review is useful because it solves an operational pain point that appears as soon as OpenClaw becomes successful inside an organization: visibility. The more agents you run, the more you need a shared monitoring surface for OpenClaw, AI agent monitoring, self-hosted dashboard workflows, and real-time bot tracking. This project gives that visibility in a form that is easy to deploy, easy to understand, and aligned with the way self-hosters already operate.