Key Takeaways: Swetrix gives you Google Analytics-grade traffic, funnel, performance, and error insights from a single sub-5 KB tracking script – cookieless, GDPR-compliant by design, and fully self-hostable with one Docker Compose command.
What is Swetrix?
If you have ever weighed Google Analytics against a 50-page consent banner, or watched your bounce rate jump every time someone rejected cookies, you already know the gap that Swetrix is trying to fill. It is a fully open-source, privacy-focused, cookieless alternative to Google Analytics – designed to give you all the insights you need to understand your visitors without invading their privacy or triggering a GDPR audit.
The project lives on GitHub at Swetrix/swetrix with the hosted product, documentation, and live demo at swetrix.com. It has been actively developed since 2021 by a bootstrapped UK company, with the cloud version running on Hetzner in Germany and a Community Edition (CE) that you can self-host on any Linux VPS in minutes.
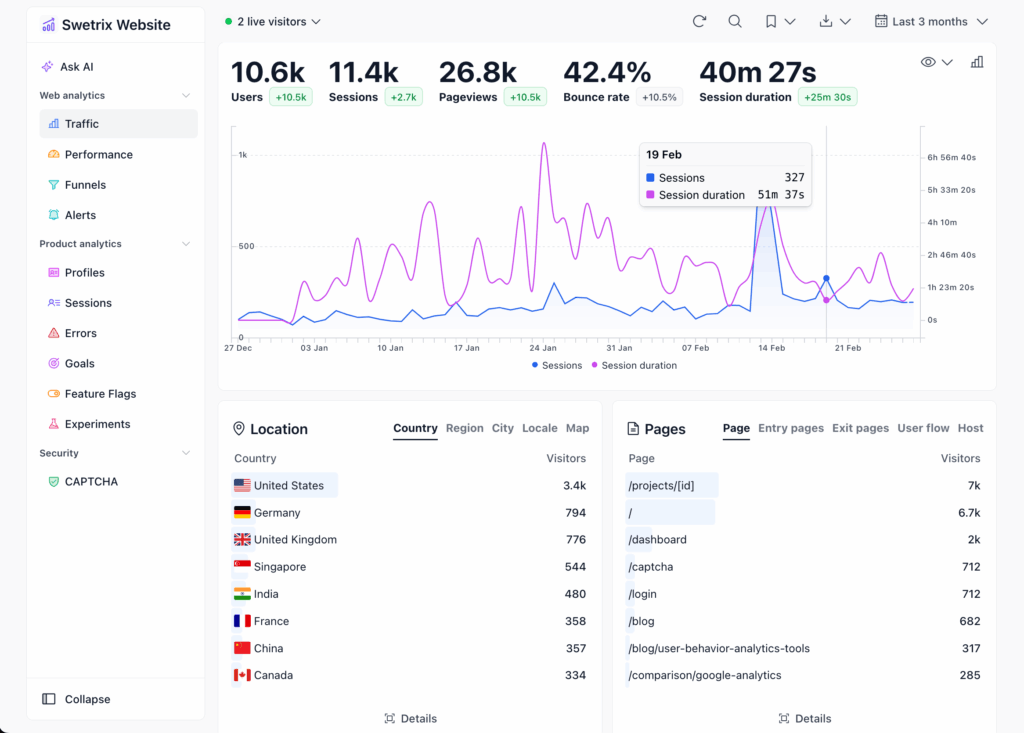
What makes Swetrix worth a serious look in 2026 is that it does not stop at pageviews. The same lightweight tracking script powers funnels, session analytics, user flows, performance monitoring, error tracking, custom events, and network intelligence – features that usually require a tool like Mixpanel, a separate APM, and a third error-tracking SaaS bolted together.
Why Swetrix stands out
There are at least a dozen open-source Google Analytics alternatives in the market. Swetrix earns its place with a tight, opinionated feature set.
Privacy-first by design. No cookies, no cross-device fingerprinting, all data stored anonymized. You get clean traffic numbers without the consent banner that kills your conversion rate.
A genuinely tiny tracking script. Under 5 KB, with no impact on Core Web Vitals. Compare that to GA4 or Mixpanel, which add tens to hundreds of kilobytes.
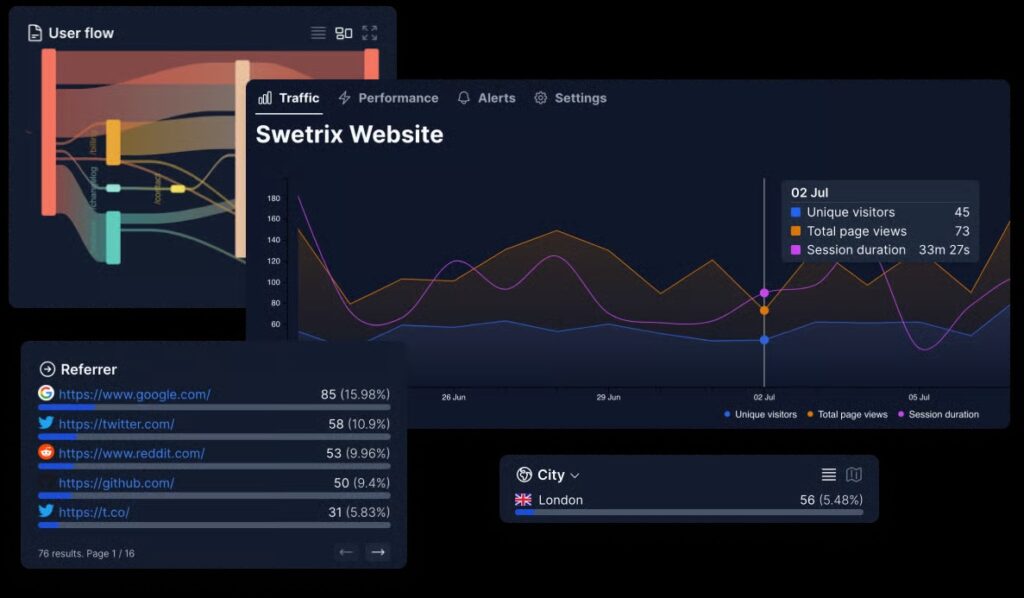
Real funnels and session flows. Visualize drop-offs, see exactly where users abandon their checkout, and replay aggregated user journeys – features that traditional pageview-only tools like Plausible do not provide.
Network intelligence. Break traffic down by ISP, organisation, usage type (residential, business, hosting, cellular), and connection type. This is the killer feature for spotting bot traffic, datacenter scrapers, and identifying who your audience actually is.
Performance and error tracking under one roof. Real-user metrics for TTFB, DNS, TLS, and render time keep your site fast, and client-side error capture with aggregated views replaces a separate error-tracking subscription.
Custom events, properties, and goals. Track conversions, sales, signups, or any key action with your own semantics – the product-analytics half of the equation.
Data portability. Export to CSV and access raw data through a documented developer API. Your data, your rules.
Cloud or community, your choice. The cloud tier (from $19/month with a free trial) adds A/B experiments, revenue analytics, an AI chat-with-your-data assistant, alerts via Slack/Telegram/Discord/webhook, and a premium GeoIP database. The Community Edition ships the same core analytics – traffic, events, sessions, funnels, performance, errors – and runs entirely on your hardware.
The stack reflects production seriousness: NestJS for the API, MySQL/TypeORM for relational data, ClickHouse for analytics events, Redis for cache, and a React Router + Tailwind front end with billboard.js charts.
Installing Swetrix Community Edition
Self-hosting Swetrix is one of the simplest deployments in the open-source analytics space. The team maintains a dedicated selfhosting repository with a Docker Compose file and a configuration helper script.
Prerequisites
You will need a Linux server (Ubuntu 24.04 is what the team tests against) with x86_64 or arm64 architecture, Docker and Docker Compose installed, and at least 2 GB of RAM for comfortable performance. Hetzner Cloud is the recommended provider, but any VPS works. If Docker is missing, the configuration script can install it for you.
Step 1 – Clone the self-hosting repo
git clone https://github.com/Swetrix/selfhosting
cd selfhosting
This repository contains the compose.yaml file plus the configure.sh helper. The main Swetrix code is pulled in as prebuilt Docker images so you do not have to compile anything.
Step 2 – Run the configuration script
./configure.shThe script checks for Docker and Docker Compose, offers to install them if they are missing, then walks you through an interactive Q&A: your BASE_URL, admin credentials, database passwords, and a few other essentials. The answers are written to a .env file in the repository directory, which you can edit later if needed.
Step 3 – Start the stack
docker compose up -dThis brings up five containers:
swetrix-fe– the React Router front end (internal port 3000)swetrix-api– the NestJS API server (internal port 5005)nginx-proxy– the public-facing reverse proxy (port 80)redis– cache layerclickhouse– analytics and transactional data store
Once the containers are healthy, point your browser at http://your-host (or your configured domain) and you will see the Swetrix dashboard. The first account you create becomes the admin.
Step 4 – Sit behind a reverse proxy
In Swetrix v5, API requests are routed through the web entrypoint at /backend/ so you only expose a single service to the internet. If you put Cloudflare in front, set CLIENT_IP_HEADER=cf-connecting-ip. Behind Traefik or another reverse proxy without Cloudflare, CLIENT_IP_HEADER=x-forwarded-for is usually correct.
Updating later
To upgrade, check the release notes for any database migrations, back up your ClickHouse and MySQL volumes, then pull the latest images and restart the stack with docker compose pull && docker compose up -d.
Using Swetrix day to day
With the dashboard running, the workflow is straightforward.
Step 1 – Create your first project
Inside the Swetrix dashboard, click “New Project,” give it a name, and copy the project ID that appears. This is the only credential the tracking script needs.
Step 2 – Add the tracking script
Paste the snippet into the <head> of every page you want to track:
<script src="https://swetrix.org/swetrix.js" defer></script>
<script>
  document.addEventListener('DOMContentLoaded', function () {
    swetrix.init('YOUR_PROJECT_ID', {
      apiURL: 'https://your-swetrix-domain.com/log',
    });
    swetrix.trackViews();
  });
</script>
For a self-hosted instance you can also host the tracking script alongside your front end. If you build with React, Next.js, Astro, or any modern framework, the team maintains an npm package, swetrix-js, that exposes the same API:
npm install swetrix-jsimport * as swetrix from 'swetrix-js';
swetrix.init('YOUR_PROJECT_ID', {
apiURL: 'https://your-swetrix-domain.com/log',
});
swetrix.trackViews();Step 3 – Track custom events and goals
Pageviews are useful, but conversions are where the money is. Fire a custom event whenever something important happens:
swetrix.track({
  ev: 'signup_completed',
  meta: { plan: 'pro' },
});
Define goals in the dashboard against those events to see conversion rates over time and build funnels that string several steps together.
Step 4 – Build funnels and analyze sessions
Inside your project, open the Funnels tab and add the events that represent your conversion path – for example, pageview /pricing → clicked_signup_button → signup_completed. Swetrix shows drop-off rates between each step and lets you filter by source, country, device, or any custom property. Open the Sessions tab to see anonymized journeys across your site, useful for diagnosing UX bottlenecks.
Step 5 – Monitor performance and errors
Enable performance monitoring in your script options to start capturing real-user metrics – TTFB, DNS, TLS, render – broken down by page, country, and device. Enable error tracking to capture client-side JavaScript exceptions with stack traces and aggregated views. Both are powered by the same tracking script you already installed.
Step 6 – Share dashboards, invite teammates, export data
Make a dashboard public, lock it behind a password for a client report, or invite teammates directly with roles. When you need raw data, hit the developer API or export to CSV – your data never gets locked behind a paywall.
Who Swetrix is for
Swetrix is a strong fit for indie developers, SaaS founders, and small product teams who want Mixpanel-style funnels and goals without a Mixpanel-style bill. It is ideal for European businesses that need clean GDPR compliance without a 50-page cookie banner, and for open-source maintainers who want their analytics tool to be auditable end to end. It is less ideal if your team is already heavily invested in ad-network attribution across dozens of channels or needs enterprise-grade SSO and on-call SLAs – areas where the cloud tier helps, but where a larger vendor may still win.
Final thoughts
The open-source analytics space has finally caught up to the closed-source giants on features, and Swetrix is one of the cleanest examples. By combining cookieless web analytics, product funnels, network intelligence, performance metrics, and error tracking under a single tiny script – and shipping the whole thing as a Docker Compose stack you can deploy in five minutes – it removes most of the reasons you ever needed Google Analytics in the first place.
Star the GitHub repository, spin up a VPS, run ./configure.sh && docker compose up -d, and your next dashboard refresh can show real visitors, real funnels, and real performance numbers – without a cookie banner in sight.