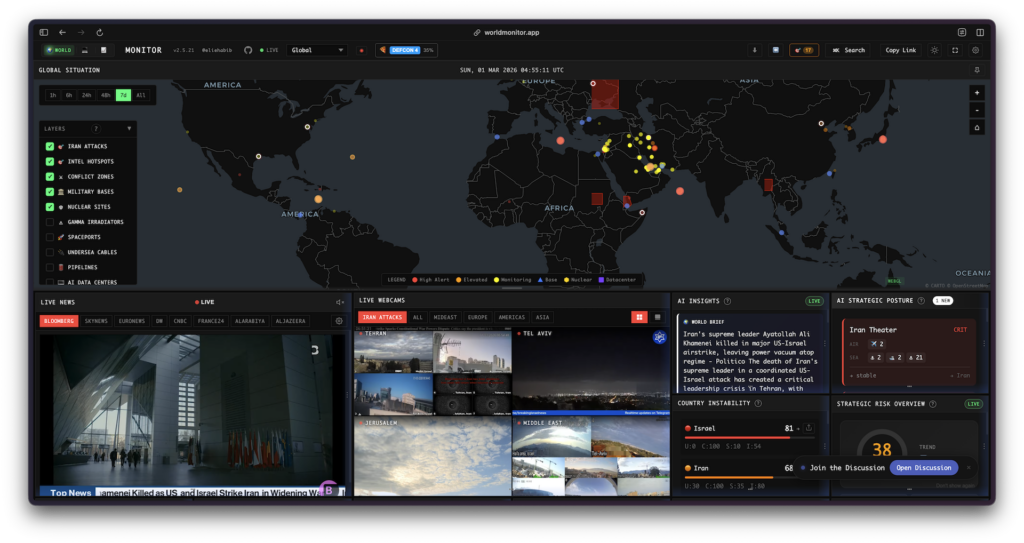
World Monitor is a free and open-source real-time global intelligence dashboard that consolidates AI-powered news aggregation, geopolitical event monitoring, military tracking, financial market signals, and critical infrastructure surveillance into a single unified situational awareness interface. Built by developer koala73, it is licensed under the GNU AGPL v3 and is available as a web application, a Progressive Web App (PWA), and a native desktop application for Windows, macOS, and Linux.
The project answers a clear problem that analysts, researchers, journalists, and security professionals face every day: global intelligence data is scattered across dozens of platforms, often siloed behind expensive subscriptions, and rarely connected to one another in a way that reveals meaningful patterns. World Monitor changes that by aggregating more than 100 curated news sources, 40-plus toggleable geospatial data layers, live military flight and naval vessel tracking, satellite fire detection, internet outage data, cryptocurrency and macro market signals, and LLM-synthesized intelligence briefs – all rendered on a 3D WebGL globe – without requiring any paid OSINT subscription.
You can try it immediately at worldmonitor.app, or you can self-host the entire stack on your own infrastructure.
Why World Monitor Matters in 2026
The landscape of open-source intelligence tools has evolved dramatically, but most solutions remain either too narrow (covering only one data type), too expensive (commercial OSINT platforms routinely cost hundreds or thousands of dollars per month), or too dependent on cloud-hosted AI that requires data to leave your machine. World Monitor addresses all three shortcomings at once.
Its AI summarization pipeline is built around a four-tier fallback chain: it first attempts a locally running Ollama or LM Studio instance (so no data ever leaves your device), then falls back through Groq cloud inference, then OpenRouter, and finally degrades gracefully to a browser-side T5 model via Transformers.js. The result is that the dashboard produces coherent intelligence briefs regardless of whether you have an API key or an internet connection to an AI provider.
From a geospatial standpoint, the 3D deck.gl and MapLibre GL JS rendering engine delivers smooth 60 frames per second even with thousands of concurrent map markers, and the Country Instability Index (CII) produces a real-time scored composite of unrest, security activity, and information velocity for every country on earth – not just a static risk tier list.
Platform Variants
World Monitor runs four distinct variants from a single codebase. Each variant loads a different curated set of data feeds, map layers, and intelligence panels tuned for a specific audience.
| Variant | Live URL | Primary Focus |
|---|---|---|
| World Monitor | worldmonitor.app | Geopolitics, conflicts, military, infrastructure |
| Tech Monitor | tech.worldmonitor.app | Startups, AI/ML, cloud, cybersecurity, semiconductors |
| Finance Monitor | finance.worldmonitor.app | Global markets, central banks, Gulf FDI, WTO trade policy |
| Happy Monitor | happy.worldmonitor.app | Positive news, uplifting stories, constructive developments |
A compact variant switcher in the header of every deployment lets users navigate between variants instantly while preserving their current map position and panel layout.
Core Features at a Glance
The Interactive 3D Globe and Map Layers
The centerpiece of World Monitor is an interactive globe rendered using deck.gl and MapLibre GL JS. It supports a full 3D pitch-and-rotation mode as well as a flat 2D mode configurable through the VITE_MAP_INTERACTION_MODE environment variable. The globe displays more than 40 toggleable data layers organized by category:
- Geopolitical layers: Active conflict zones sourced from UCDP and ACLED, intelligence hotspots with news correlation scores, social unrest events from ACLED and GDELT (Haversine-deduplicated), natural disasters from USGS, GDACS, and NASA EONET, sanctions regimes, cyber threat indicators of compromise (IOCs) geo-located in real time, GPS/GNSS jamming zones derived from ADS-B transponder analysis, and severe weather alerts.
- Military and strategic layers: 220-plus military bases from nine operators, live military flight tracking via ADS-B, naval vessel monitoring via AIS, nuclear facilities and gamma irradiators, APT cyber threat actor attribution, and spaceports and launch facilities.
- Infrastructure layers: Undersea cables with landing points and cable health advisories, oil and gas pipelines, 111 major AI datacenter clusters with at least 10,000 GPUs each, 83 strategic ports, internet outage data from Cloudflare Radar, critical mineral deposits, NASA FIRMS satellite fire detection (VIIRS thermal hotspots), 19 global trade routes through strategic chokepoints, and airport delays across 128 monitored airports.
- Finance layers (Finance variant): 92 global stock exchanges, 19 financial centers, 13 central banks, BIS policy rate data, 10 commodity hubs, Gulf FDI investments, and WTO trade policy intelligence.
Eight regional presets (Global, Americas, Europe, MENA, Asia, Africa, Oceania, Latin America) provide instant navigation context. Time filtering lets users restrict visible events to the past 1, 6, 24, or 48 hours, or the past 7 days. All map state – center, zoom, active layers, and time range – is encoded in the URL for shareable views.
AI-Powered Intelligence
The AI intelligence layer is not a simple chatbot wrapper. It is a multi-module analysis system that synthesizes signals from across all data streams:
- World Brief: An LLM-synthesized narrative summary of top global developments, generated by the four-tier provider chain (Ollama/LM Studio → Groq → OpenRouter → browser T5). Results are Redis-cached for 24 hours and content-deduplicated so that identical headlines from 1,000 concurrent users trigger exactly one LLM call.
- Country Instability Index (CII): A real-time composite score for every country, combining a 40-percent unrest component (ACLED protests, GDELT events, fatality counts), a 30-percent security component (military flights, naval vessels), and a 30-percent information component (news velocity, alert clusters). Twenty-three tier-one nations have tuned baseline risk profiles; all other countries receive universal scoring as soon as event data is detected.
- Focal Point Detection: Cross-correlates entities across news feeds, military activity, protests, internet outages, and markets to identify geographic convergence zones.
- Trending Keyword Spike Detection: Monitors a two-hour rolling window against a seven-day baseline and flags surging terms across all RSS feeds, with automatic CVE/APT entity extraction and AI-generated context summaries.
- Strategic Posture Assessment: A composite risk score combining all intelligence modules with trend detection and theater-level military aggregation.
- Hybrid Threat Classification: An instant keyword classifier with asynchronous LLM override for higher-confidence results.
The local LLM support deserves particular emphasis. The desktop application auto-discovers available models from any running Ollama or LM Studio instance, populates a dropdown filtered to exclude embedding-only models, and routes all AI summarization through the local endpoint. No API keys are required and no data leaves the machine.
Signal Intelligence and Anomaly Detection
World Monitor’s signal engine continuously monitors for 12 distinct signal types across news, markets, military, and infrastructure domains:
- Convergence: Three or more independent source types confirm the same story within 30 minutes.
- Triangulation: Wire service, government official, and defense intelligence sources align simultaneously – the “authority triangle.”
- Velocity Spike: A topic’s mention rate doubles with six or more source publications per hour.
- Prediction Leading: A prediction market (Polymarket) moves five percent or more before significant news coverage appears.
- Silent Divergence: A market moves two percent or more with no correlated news after exhaustive entity-aware search.
- Geographic Convergence: Three or more distinct event types appear within the same one-degree-by-one-degree grid cell simultaneously.
- Military Surge: Transport or fighter aircraft activity reaches twice the regional baseline for that day of the week and season, computed using Welford’s online algorithm over a 90-day rolling window.
Each signal includes a “Why It Matters” explanation and an “Actionable Insight” field that transforms raw pattern detection into guidance a human analyst can act on immediately.
News Aggregation and Live Streams
The dashboard aggregates more than 150 RSS feeds across geopolitics, defense, energy, technology, finance, and regional news. Sources are tiered by authority (wire services and official government at Tier 1, through domain specialists at Tier 3, through aggregators at Tier 4) and categorized by function for triangulation detection. State-affiliated media outlets (Xinhua, TASS, RT, CGTN, PressTV) are included with visual propaganda risk badges rather than filtered out, because what state media chooses to report and omit is itself a signal.
News clustering uses Jaccard similarity with an inverted-index optimization that reduces pairwise comparisons from roughly 10,000 to roughly 500 for a typical news load. Virtual scrolling ensures panels with many items render only the visible DOM elements plus a three-item overscan buffer, keeping the interface fast even with hundreds of headlines loaded simultaneously.
Eight-plus live video streams from Bloomberg, Sky News, Al Jazeera, Euronews, DW, France 24, CNBC, and Al Arabiya are embedded natively. Ten channels stream via HLS directly rather than YouTube iframes, bypassing cookie popups and bot checks. The dashboard also maintains 22 live webcams from geopolitical hotspots organized into five regional tabs.
Desktop Application and Progressive Web App
The Tauri-based native desktop application packages the full dashboard with a local Node.js sidecar that runs all API handlers locally. It stores API keys in the OS keychain (macOS Keychain, Windows Credential Manager) rather than plaintext files, and uses a unique per-launch session token to prevent other local processes from accessing the sidecar on localhost. When a local API handler fails, requests transparently fall through to the cloud deployment. The settings window provides three tabs: LLMs (Ollama endpoint, model selection, Groq, OpenRouter), API Keys (12-plus data source credentials with per-key validation), and Debug and Logs.
The PWA variant uses smart caching strategies: map tiles are cached with a CacheFirst strategy (up to 500 tiles, 30-day TTL) enabling map browsing without a network connection, while news feeds use a NetworkOnly strategy so data is always fresh. An auto-updating service worker checks for new versions every 60 minutes.
Installation Guide
Prerequisites
Before installing World Monitor, ensure the following are available on your system:
- Node.js version 18 or later
- npm version 9 or later (included with Node.js)
- A Git client
- (Optional) Vercel CLI for cloud deployment
- (Optional) Ollama for local LLM inference with no API keys
Option 1: Deploy to Vercel (Recommended for Most Users)
Vercel is the recommended deployment path because it runs the edge functions natively on a generous free tier.
Step 1 – Clone the repository
git clone https://github.com/koala73/worldmonitor.git
cd worldmonitor
Step 2 – Install dependencies
npm installStep 3 – Install the Vercel CLI globally
npm install -g vercelStep 4 – Prepare your environment variables
Copy the example environment file and fill in the values for the data sources you want to enable. All keys are optional; the dashboard functions without them, but the corresponding features will be disabled.
cp .env.example .env.localOpen .env.local in a text editor and fill in whichever keys are relevant to your use case (see the Environment Variables Reference section below).
Step 5 – Deploy to Vercel
vercel --prodFollow the interactive prompts. When asked about environment variables, add them via the Vercel dashboard under Settings > Environment Variables, or pass them during the vercel CLI setup.
Step 6 – Access your deployment
Once the deployment completes, Vercel will provide a URL. Open it in a browser to access your own hosted World Monitor instance.
Option 2: Run Locally with npm
Step 1 – Clone and install
git clone https://github.com/koala73/worldmonitor.git
cd worldmonitor
npm install
Step 2 – Set up environment variables
cp .env.example .env.local
# Edit .env.local with your preferred text editor
Step 3 – Start the development server
npm run devThe dashboard will be available at http://localhost:5173 by default.
Step 4 – Build for production
npm run build
npm run preview
Option 3: Download the Native Desktop Application
Pre-built desktop binaries are available directly from the project’s GitHub Releases page or via the download API:
| Platform | Download URL |
|---|---|
| Windows (EXE) | https://worldmonitor.app/api/download?platform=windows-exe |
| macOS ARM64 (Apple Silicon) | https://worldmonitor.app/api/download?platform=macos-arm64 |
| macOS x64 (Intel) | https://worldmonitor.app/api/download?platform=macos-x64 |
| Linux (AppImage) | https://worldmonitor.app/api/download?platform=linux-appimage |
No build steps are required for the desktop app. Download, install, and launch. The application will auto-discover any locally running Ollama or LM Studio instance on first launch.
Environment Variables Reference
The following table covers the most important environment variables. All are optional; the dashboard degrades gracefully when any key is absent.
AI and Summarization
| Variable | Purpose | Where to Obtain |
|---|---|---|
GROQ_API_KEY | Primary LLM summarization (14,400 requests/day on free tier) | console.groq.com |
OPENROUTER_API_KEY | Fallback LLM summarization (50 requests/day on free tier) | openrouter.ai |
Caching
| Variable | Purpose | Where to Obtain |
|---|---|---|
UPSTASH_REDIS_REST_URL | Cross-user AI call deduplication and risk score caching | upstash.com |
UPSTASH_REDIS_REST_TOKEN | Authentication token for Upstash Redis | Same as above |
Market and Economic Data
| Variable | Purpose | Where to Obtain |
|---|---|---|
FINNHUB_API_KEY | Real-time stock quotes | finnhub.io |
EIA_API_KEY | U.S. oil prices, production, and inventory | eia.gov/opendata |
FRED_API_KEY | Federal Reserve Economic Data (interest rates, yields, assets) | fred.stlouisfed.org |
Geopolitical and Conflict Data
| Variable | Purpose | Where to Obtain |
|---|---|---|
ACLED_ACCESS_TOKEN | Armed Conflict Location and Event Data (free for researchers) | acleddata.com |
CLOUDFLARE_API_TOKEN | Internet outage data via Cloudflare Radar | Cloudflare dashboard |
NASA_FIRMS_API_KEY | Satellite fire detection (VIIRS thermal hotspots) | firms.modaps.eosdis.nasa.gov |
Transport Tracking (Railway Relay)
| Variable | Purpose | Where to Obtain |
|---|---|---|
AISSTREAM_API_KEY | Live AIS vessel tracking | aisstream.io |
OPENSKY_CLIENT_ID | OpenSky aircraft tracking with higher rate limits | opensky-network.org |
OPENSKY_CLIENT_SECRET | OpenSky OAuth2 credentials | Same as above |
Site Configuration
| Variable | Default | Purpose |
|---|---|---|
VITE_VARIANT | full | Dashboard variant: full, tech, finance |
VITE_MAP_INTERACTION_MODE | 3d | Map mode: 3d (pitch/rotation) or flat (2D only) |
VITE_WS_API_URL | (empty) | API base URL override for same-domain installs |
Several data sources (UCDP conflict data, UNHCR refugee data, Open-Meteo climate data, WorldPop density data) require no API keys and are used automatically.
Setting Up Local LLM with Ollama (No API Keys Required)
If you prefer to run all AI inference locally without any external API calls:
- Install Ollama on your machine.
- Pull a supported model:
ollama pull llama3.1:8b- Ensure Ollama is running:
ollama serve- In the desktop app, open Settings (Cmd+, or Ctrl+,), navigate to the LLMs tab, and set the Ollama endpoint to
http://localhost:11434. The app will auto-discover available models. - In a web deployment, set
OLLAMA_ENDPOINT=http://localhost:11434in your.env.local. This works when the Vercel dev server and Ollama are running on the same machine.
Using World Monitor: A Guided Tour
Navigating the Map
The 3D globe is the primary navigation surface. Drag to pan, scroll to zoom, and use two-finger gestures or right-click-drag to pitch and rotate in 3D mode. The FOCUS dropdown in the header provides one-click jumps to eight regional presets. The time filter controls beneath the map constrain all visible event markers to a selected window. The pin button locks the map in a fixed position so it stays visible while you scroll through the intelligence panels below.
Use the layer toggle panel to selectively enable the data layers most relevant to your current task. For a conflict monitoring session, you might enable Conflicts, Hotspots, Protests, Military Bases, and Naval Ships. For an infrastructure risk assessment, you might switch to Undersea Cables, Pipelines, AI Datacenters, and Internet Outages. Layer choices are encoded in the URL so you can share a specific view configuration with colleagues.
Using the Command Palette
Press Cmd+K (or Ctrl+K on Windows and Linux) to open the command palette. It provides fuzzy search across 20-plus result types including news articles, countries, map hotspots, infrastructure assets, nuclear facilities, and layer presets. Typing layers:military activates the full military layer group in one keystroke. Typing any country name navigates directly to that country’s intelligence brief. Recent searches are saved in localStorage for fast recall.
Reading Intelligence Panels
Below the map, the dashboard presents a configurable grid of intelligence panels. Each panel can be resized by dragging its edge handles and reordered by drag-and-drop. The grid automatically switches to an L-shaped layout on ultra-wide screens (2000px or wider) to maximize use of the available screen real estate.
Key panels include the AI Insights panel (LLM-synthesized World Brief with focal point detection), the Country Instability Index panel (real-time stability scores as a ranked list), the Strategic Risk Overview panel (composite risk score with trend indicators), the Infrastructure Cascade panel (dependency analysis for cables and pipelines), the Signal Intelligence panel (live anomaly alerts with confidence scores), and the Live Intelligence panel (GDELT-powered topic feeds for military, cyber, nuclear, and sanctions events).
Exploring Country Intelligence Briefs
Clicking any country on the map opens a full-page intelligence dossier. The left column presents the animated CII score ring with four component breakdown bars (Unrest, Conflict, Security, Information), an AI-generated analysis with inline citation anchors that scroll to corresponding source headlines, and the top eight most relevant news items for that country. The right column shows real-time signal chips for protests, military aircraft, naval vessels, internet outages, earthquakes, and the country’s primary stock index; a D3.js-rendered seven-day event timeline with four severity-coded lanes; the top Polymarket prediction contracts for that country by volume; and a list of infrastructure assets within 600 kilometers of the country’s geographic centroid.
Every country brief is exportable as structured JSON, flattened CSV, or a rendered PNG image. A print button triggers the browser’s native print dialog for clean PDF output.
Configuring AI Providers
The AI Flow settings panel (accessible from the dashboard header) provides 15 runtime feature toggles that control which data sources and AI providers are active. Toggle Ollama on or off, switch between Groq and OpenRouter for cloud inference, or disable the browser-local Transformers.js model to avoid ONNX model downloads. All toggles are stored in localStorage and take effect without a page reload.
Use Cases
Journalists and Media Analysts
World Monitor gives journalists a single pane of glass for monitoring breaking stories across geopolitical theaters. The Velocity Spike signal alerts when a story is accelerating across six or more sources per hour. The Convergence signal flags when three or more independent source categories confirm the same event within 30 minutes. The propaganda risk badges on state-affiliated outlets (TASS, Xinhua, RT, PressTV) help reporters immediately contextualize the source of a claim. Country briefs export as PNG images suitable for publication or inclusion in editorial briefings.
OSINT Researchers and Security Professionals
The combination of ACLED conflict data, military base mapping, ADS-B flight tracking, AIS vessel monitoring, GPS/GNSS jamming zone visualization, and Telegram OSINT feed ingestion (27 channels including Aurora Intel, BNO News, OSINTdefender, and DeepState) gives OSINT practitioners a unified collection environment without needing to pay for commercial aggregators. Cyber threat IOCs are geo-located on the globe in real time, and APT group attribution is mapped to their known operating regions. The OREF rocket alert integration provides near-real-time Israeli Home Front Command siren data useful for conflict zone monitoring.
Financial Analysts and Risk Managers
The Silent Divergence and Prediction Leading signals identify market moves that precede news coverage, giving analysts an information edge. The Finance Monitor variant adds 92 stock exchanges, 13 central banks with BIS policy rate data, Gulf FDI tracking, and WTO trade policy intelligence. The seven-signal macro radar produces a composite BUY/CASH verdict incorporating JPY liquidity signals, QQQ/XLP macro regime, Bitcoin technical trend, hash rate, Fear and Greed Index, and BTC ETF flow data. Country briefs include the primary stock market index for each country with a one-week change indicator.
Academic Researchers in International Relations and Political Science
The Country Instability Index provides a machine-readable, real-time composite signal that can be used as an independent variable in quantitative research on conflict onset, escalation, and resolution. All country brief data is exportable as structured JSON or CSV, enabling direct ingestion into statistical analysis pipelines. The 90-day rolling baseline anomaly detection (Welford’s online algorithm with Z-score thresholds at 1.5, 2.0, and 3.0) provides a rigorous statistical foundation for measuring deviation from regional norms.
NGOs and Humanitarian Organizations
The HAPI humanitarian data integration (UN OCHA humanitarian access metrics and displacement flows), UNHCR data, government travel advisory aggregation from four governments (US State Department, Australia DFAT, UK FCDO, New Zealand MFAT), and population exposure estimation (WorldPop density data for civilian populations within event-specific radii) give humanitarian workers the situational awareness tools normally available only to large organizations with dedicated intelligence teams.
Corporate Security and Operational Risk Teams
Enterprises with global operations can use World Monitor to monitor supply chain chokepoints (the AIS chokepoint detection system covers the Strait of Hormuz, Suez Canal, Malacca Strait, Bab el-Mandeb, Panama Canal, Taiwan Strait, South China Sea, and Turkish Straits), undersea cable health, datacenter outages, and sanctions developments — all on a single dashboard deployable behind a corporate firewall via the self-hosted installation path.
Privacy-Conscious Individual Users
For individuals who want to stay informed about global events without feeding behavioral data to commercial news platforms or cloud AI providers, the combination of self-hosting and local Ollama inference means the dashboard can operate in a fully air-gapped mode for all AI features. All API keys are stored in the OS keychain rather than browser localStorage, and the desktop app generates a unique session token per launch to isolate the sidecar from other local processes.
Development Ideas and Extension Opportunities
The World Monitor codebase is architected in a way that invites extension. The following ideas represent natural development directions grounded in the repository’s existing design patterns:
Custom Domain Variants
The variant system (configured via VITE_VARIANT) allows any developer to create a domain-specific fork by defining a new curated set of RSS feeds, map layers, and intelligence panels. Potential variants include a Health Monitor (epidemic surveillance, WHO alerts, pharmaceutical supply chains), an Energy Monitor (power grid status, renewable energy capacity, LNG shipping routes), a Climate Monitor (extreme weather events, deforestation, sea surface temperature anomalies), or a Supply Chain Monitor (port congestion, trade route disruptions, sanctions impacts on logistics).
Custom Alert and Notification Pipelines
The signal intelligence system already produces structured alert objects with type, confidence score, affected countries, and reasoning. A natural extension is to build a notification delivery layer that routes high-priority alerts to Slack, Teams, PagerDuty, or email. The Railway relay server already handles the relay architecture; a notification microservice could subscribe to the signal feed and dispatch messages to configured channels.
Integration with Threat Intelligence Platforms
The APT group tracking, cyber threat IOC geo-location, and CVE entity extraction in the trending keywords system are natural integration points for STIX/TAXII feeds, MISP instances, or commercial threat intelligence platforms. Extending the entity registry with MITRE ATT&CK technique identifiers and mapping news headlines to TTPs would produce a hybrid OSINT/threat intelligence feed useful to security operations centers.
Automated Report Generation
The country brief export system (JSON, CSV, PNG) provides the data foundation for automated report generation. A scheduled job could pull country briefs for a set of monitored nations, generate a structured daily intelligence report, and distribute it via email or a document management system. The /api/og-story endpoint already generates formatted SVG cards for social sharing; the same pattern could be extended to produce full-page PDF reports via a headless browser rendering pipeline.
Enterprise Multi-Tenant Deployment
The feature toggle system (15 runtime toggles stored in localStorage) and the variant architecture provide the foundation for a multi-tenant deployment where different user groups see different data layers and intelligence panels. Adding a server-side configuration layer backed by a database would allow an enterprise deployment to serve tailored dashboards to different teams (executive leadership, regional security managers, supply chain analysts) from a single installation.
SIEM and SOC Integration
The internet outage data, GPS jamming zones, cyber threat IOC geo-location, and APT group mapping are directly relevant to security operations centers. Exporting these signals in CEF (Common Event Format) or in a format compatible with Splunk, Elastic SIEM, or Microsoft Sentinel would allow World Monitor to feed into existing SOC workflows as a geopolitical context enrichment layer.
Custom Entity Registry Extensions
The entity registry (600-plus entries with aliases, keywords, sector affiliations, and competitor relationships) is the backbone of the market-news correlation engine. Developers working with proprietary datasets could extend the registry with industry-specific entities – pharmaceutical companies and drug pipeline keywords for a healthcare analyst, defense contractors and procurement keywords for a government researcher, or fintech firms and regulatory terms for a financial compliance team.
Mobile-Native Application
The current PWA implementation provides offline map support and installable home screen access, but a native iOS or Android application built with React Native or a Tauri mobile target would enable push notifications for high-priority signals, background refresh, and deeper OS integration (widgets, lock screen summaries). The existing API layer and signal system provide the backend without modification.
Technology Stack
| Layer | Technology | Purpose |
|---|---|---|
| Language | TypeScript 5.x | Type safety across 60-plus source files |
| Build | Vite | Fast hot module replacement and optimized production builds |
| Map rendering | deck.gl + MapLibre GL JS | WebGL-accelerated 3D globe and 2D map |
| Data visualization | D3.js | Event timelines, sparklines, donut gauges |
| Desktop app | Tauri | Native Windows, macOS, Linux application |
| Browser ML | Transformers.js (ONNX) | Client-side NER, sentiment analysis, T5 summarization |
| Testing | Playwright | End-to-end regression testing for map overlay behavior |
| Caching | Upstash Redis | Cross-user AI call deduplication with 24-hour TTL |
| Deployment | Vercel edge functions | Serverless API handlers, RSS proxy, AI summarization |
| Transport relay | Railway (Node.js) | AIS vessel tracking, OpenSky aircraft, RSS proxy, Telegram MTProto |
| License | GNU AGPL v3 | Copyleft open-source |
Comparison with Commercial Alternatives
| Capability | World Monitor | Typical Commercial OSINT Platform |
|---|---|---|
| Cost | Free and open source | $500–$5,000+ per month |
| News sources | 150+ RSS feeds | Varies (often paywalled) |
| Map data layers | 40+ | Limited or tiered |
| AI summarization | Local or cloud, user-controlled | Cloud-only, vendor-controlled |
| Data privacy | Self-hosted option, OS keychain | Data processed by vendor |
| Military tracking | 220+ bases, ADS-B, AIS | Typically limited or extra cost |
| Financial signals | 7-signal macro radar, 92 exchanges | Separate subscriptions required |
| Desktop app | Native Tauri app (Windows/macOS/Linux) | Web-only or proprietary clients |
| Source code | Fully open under AGPL v3 | Closed source |
Conclusion
World Monitor represents a new category of tool: an enterprise-grade global intelligence dashboard that is simultaneously free, open-source, privacy-respecting, and architecturally sophisticated enough to stand alongside commercial OSINT platforms that cost orders of magnitude more. Its combination of AI-synthesized intelligence briefs, a 3D geospatial interface with 40-plus data layers, real-time signal anomaly detection, local LLM support, and a native cross-platform desktop application makes it immediately useful to a wide range of professionals – from investigative journalists to corporate risk managers to academic researchers – without requiring any financial commitment or cloud data exposure.
The project is actively maintained, with regular releases adding new data sources, intelligence layers, and features. Whether you deploy it on Vercel in five minutes or run it entirely on local hardware with Ollama, World Monitor gives you access to a level of global situational awareness that was previously available only to well-funded organizations.
Start exploring at worldmonitor.app, or clone the repository and deploy your own instance today.
- GitHub Repository: github.com/koala73/worldmonitor
- Live Demo (Geopolitical): worldmonitor.app
- Tech Variant: tech.worldmonitor.app
- Finance Variant: finance.worldmonitor.app
- Full Documentation: github.com/koala73/worldmonitor/blob/main/docs/DOCUMENTATION.md
- License: GNU AGPL v3