CheckCle: Self‑Hosted Real‑Time Infrastructure Monitoring with Docker

Key Takeaway:
CheckCle gives DevOps teams a fast, self-hosted way to centralize uptime checks, incident tracking, and distributed monitoring into one lightweight, Docker-friendly platform.
CheckCle is a self-hosted, open-source monitoring platform built for real-time oversight of full-stack systems, applications, and infrastructure. It targets DevOps engineers, sysadmins, and developers who want a deploy-anywhere alternative to SaaS tools without sacrificing modern dashboards or alerting workflows.
Out of the box, CheckCle supports HTTP, TCP, ping, and DNS checks, SSL and domain monitoring, incident history, maintenance windows, and public status pages. It also offers regional (distributed) monitoring agents so you can probe your services from multiple locations to reduce false positives and catch regional outages. All of this is packaged in a single container image you can run on any Docker-capable host.

Why CheckCle Matters for Modern Monitoring
As stacks move toward microservices, multi-region deployments, and hybrid cloud, monitoring quickly fragments across many tools and dashboards. Many teams start with basic uptime checks but quickly need deeper visibility, incident timelines, and multi-channel alerts across HTTP endpoints, backend services, servers, and SSL certificates. Relying on multiple SaaS tools can introduce cost, data silos, and external dependencies you cannot control.
CheckCle consolidates these needs into one platform you fully own, combining uptime monitoring, incident management, server metrics, and distributed checks under a single UI. Because it is open source and self-hosted, you can deploy it on a small VPS, a Synology NAS, or an on‑prem cluster, integrate it with CI/CD, and scale it with your infrastructure without vendor lock-in.
Deployment Options and Prerequisites
CheckCle is distributed primarily as an official Docker image (operacle/checkcle) on Docker Hub, which is the recommended way to deploy it for most environments. You will need:
- A Linux server (or NAS/VM) with Docker installed.
- A persistent directory on the host for CheckCle’s PocketBase data.
- Optional: a reverse proxy (Nginx, Traefik, Caddy) for HTTPS and custom domains.
For quick evaluation, you can also explore the hosted demo at https://demo.checkcle.io, which uses a default admin account for testing. For production, you should always deploy your own instance and harden credentials and network access.
Step‑by‑Step Installation with Docker
Step 1: Prepare your server
SSH into a Linux host with Docker installed and create a directory to persist CheckCle’s data (PocketBase stores state there).
ssh ubuntu@your-server
sudo mkdir -p /opt/checkcle/pb_data
sudo chown -R $(whoami):$(whoami) /opt/checkcle
This folder will be mounted into the container to ensure your configuration, checks, and incidents survive restarts and upgrades.
Step 2: Run CheckCle with Docker
The GitHub repository and Docker Hub page provide a canonical docker run example. A typical command looks like this:
docker run -d \
  --name checkcle \
  --restart unless-stopped \
  -p 8090:8090 \
  -v /opt/checkcle/pb_data:/mnt/pb_data \
  --ulimit nofile=4096:8192 \
  operacle/checkcle:latest
Here’s what each flag does:
-p 8090:8090: exposes CheckCle’s web UI on port 8090 of the host.-v /opt/checkcle/pb_data:/mnt/pb_data: mounts persistent data into the container.--restart unless-stopped: keeps the container running across reboots.
Once the container is up, you can access the UI at http://your-server-ip:8090 from a browser.
Step 3: First login and credentials
In many deployments and examples (including demo environments), CheckCle ships with default admin credentials such as [email protected] and Admin123456 for initial login. Check the current docs or your installation notes, log in with the default account, and immediately change the password under the user/settings section.
For security, you should also:
- Restrict access to the CheckCle UI (VPN, firewall, IP allowlists).
- Put it behind HTTPS using a reverse proxy and TLS certificates.
Step 4: Optional Docker Compose configuration
For repeatable deployments, you can manage CheckCle via Docker Compose with an .env file for environment-specific settings.
services:
  checkcle:
    image: operacle/checkcle:latest
    container_name: checkcle
    restart: unless-stopped
    ports:
      - "${CHECKCLE_PORT:-8090}:8090"
    volumes:
      - /opt/checkcle/pb_data:/mnt/pb_data
    environment:
      - CHECKCLE_BASE_URL=${CHECKCLE_BASE_URL}
      - CHECKCLE_SMTP_HOST=${CHECKCLE_SMTP_HOST}
      - CHECKCLE_SMTP_PORT=${CHECKCLE_SMTP_PORT}
      - CHECKCLE_SMTP_USER=${CHECKCLE_SMTP_USER}
      - CHECKCLE_SMTP_PASS=${CHECKCLE_SMTP_PASS}
    ulimits:
      nofile:
        soft: 4096
        hard: 8192
Example .env:
CHECKCLE_PORT=8090
CHECKCLE_BASE_URL=https://monitor.addrom.com
CHECKCLE_SMTP_HOST=smtp.addrom.com
CHECKCLE_SMTP_PORT=587
[email protected]
CHECKCLE_SMTP_PASS=super-secret-password
Bringing it up is then as simple as:
docker compose up -dThis pattern works well for GitOps workflows, NAS setups, and homelab clusters where you want CheckCle to be part of your infrastructure-as-code.
First Steps Inside the CheckCle UI

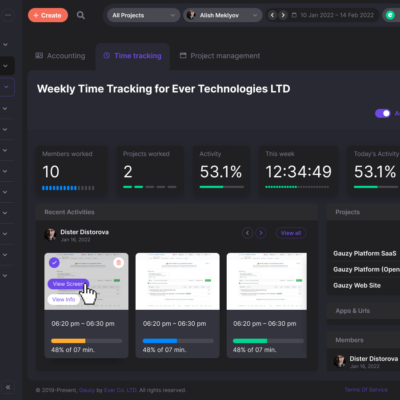
Once logged in to your new instance, you will land on the main dashboard, which surfaces high-level uptime status, recent incidents, and key metrics. The left sidebar typically contains navigation entries for uptime monitoring, regional monitoring, incident history, status pages, and settings.
Before adding checks, take a moment to:
- Set your preferred time zone and language (if available) under Settings.
- Configure SMTP or other notification providers so incidents can trigger alerts.
- Optionally, create separate users or roles if multiple team members will manage the platform.
Creating Your First Uptime Check
CheckCle’s core feature is uptime monitoring for websites and services. The flow for creating your first HTTP check is straightforward:
- In the left sidebar, go to Uptime Monitoring.
- Click New Monitor or a similar button to create a check.
- Choose the protocol: HTTP/HTTPS, TCP, Ping, or DNS.nmaas+1
- Enter the target URL or host (for example,
https://api.addrom.com/health). - Set the monitoring interval (for example, every 60 seconds) and timeout threshold.
- Optionally configure response code expectations or content checks (for example, expect status 200).
- Attach one or more notification channels or escalation policies.
After saving, CheckCle will start probing the target at the configured interval, tracking uptime, response times, and failures. The results appear in charts and incident lists, giving you a historical view of availability and performance.tom-doerr.
Configuring Alerts and Notification Channels
Alerting is where a monitoring platform proves its value, and CheckCle supports multiple channels and templates so the right people get notified at the right time. Depending on your version and configuration, you can integrate email, Telegram, and other messaging platforms, with more channels (Slack, Discord, Signal) on the roadmap or available in newer builds.
A typical alerting setup looks like this:
- Configure SMTP settings under global mail/notification settings.
- Add channels (for example, email recipients or Telegram chat IDs).
- Define templates for UP, DOWN, WARNING, and maintenance events.
- Attach channels and severity thresholds to individual monitors or groups.
This gives you fine-grained control—for example, you might send critical production outages to an on‑call group via instant messaging while routing lower-priority warnings to email only.
Distributed and Regional Monitoring
One of CheckCle’s standout features is distributed (regional) monitoring, which lets you run lightweight agents in different regions or networks and feed results back to a central CheckCle instance. This is crucial when you want to detect geo-specific connectivity issues or monitor internal services that are not publicly reachable.
The workflow typically looks like:
- In the CheckCle UI, open Regional Monitoring from the sidebar.
- Click New Regional Agent and provide a name, region label, and description.
- CheckCle generates a registration script with a token, agent ID, and server URL.
- SSH into a Linux server in the target region and run the script, which downloads and starts the agent as a background service.
- Back in CheckCle, verify that the agent appears as online and assign monitors to run via that agent.
By deploying multiple agents (for example, one each in Singapore, US‑East, and EU‑West), you can quickly see whether an outage is regional, global, or specific to one provider.
Beyond Uptime: Incidents, Maintenance, and Status Pages
Uptime metrics alone do not tell the full story; teams also need structured incident history, maintenance tracking, and stakeholder communication. CheckCle includes incident timelines for each monitor, showing UP/DOWN/WARNING transitions along with relevant metadata. You can define maintenance windows to suppress alerts during planned work, keeping dashboards “green” while still tracking actual probe results.
Public status pages allow you to expose service health externally without manually updating static pages or spreadsheets. This is especially useful for SaaS projects and internal platforms serving many teams, giving them a single place to check ongoing incidents and historical uptime.
Best Practices for Running CheckCle in Production
To get the most from CheckCle in real-world environments:
- Start small: onboard a few critical services first, validate alerting, then expand coverage.
- Use semantic naming: name monitors by service and environment (for example,
api-prod-eu-http) for easy filtering. - Combine global and regional checks: monitor internet‑facing endpoints globally and internal services via regional agents.
- Harden access: secure the admin account, enforce HTTPS, and restrict UI access to trusted networks.
- Back up data: back up the PocketBase data directory regularly to avoid losing incident history and configuration.
CheckCle’s open-source model and Docker‑first deployment make it a compelling choice for teams who want powerful monitoring without being tied to a third‑party SaaS. To dive deeper into features, configuration options, and the development roadmap, explore the official site at https://checkcle.io and the GitHub repository at https://github.com/operacle/checkcle.